Figure 4.

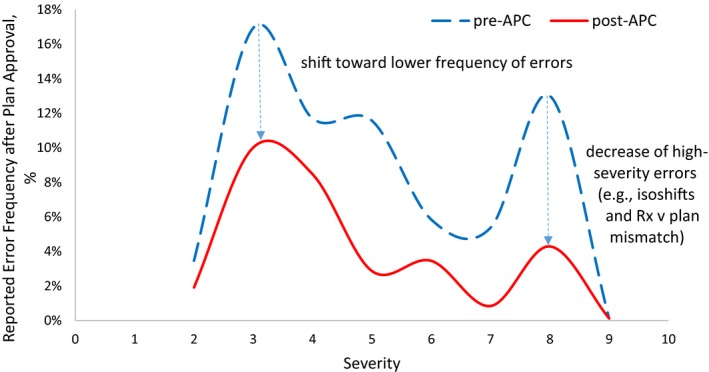
Histogram of reported errors stratified by severity and normalized by total number of errors 9 months pre‐automated plan check (APC) and 9 months post–APC.

Histogram of reported errors stratified by severity and normalized by total number of errors 9 months pre‐automated plan check (APC) and 9 months post–APC.