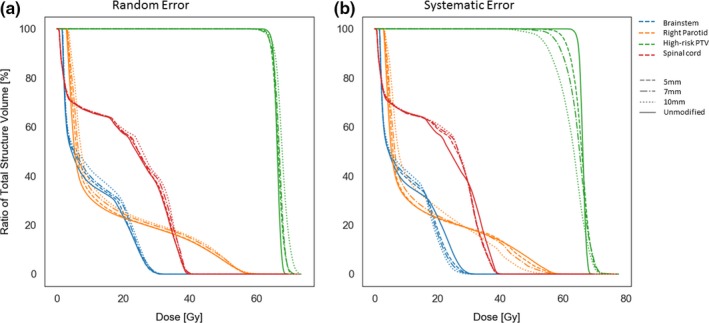
Figure 3.

Comparison of cumulative dose–volume histogram at (a) random and (b) systematic errors. Dose–volume histogram shown is for a single patient. The 3 mm error is omitted owing to viewing constraints, but it behaved according to the overall trend. PTV, planning target volume.
