
Figure 5.
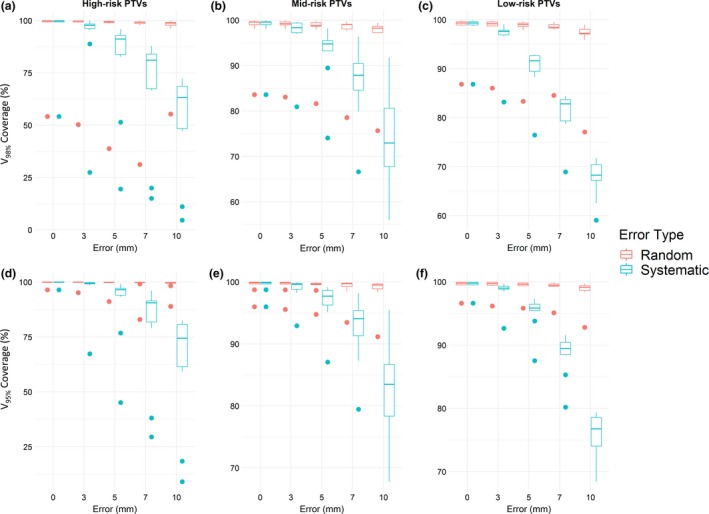
Changes in planning target volume (PTV) coverage as the magnitude of error increased. (a–c) V98% coverage for high‐, mid‐, and low‐risk PTV, respectively. (d–f) V95% coverage for high‐, mid‐, and low‐risk PTV. Points indicate outliers.
Official websites use .gov
A
.gov website belongs to an official
government organization in the United States.
Secure .gov websites use HTTPS
A lock (
) or https:// means you've safely
connected to the .gov website. Share sensitive
information only on official, secure websites.
Changes in planning target volume (PTV) coverage as the magnitude of error increased. (a–c) V98% coverage for high‐, mid‐, and low‐risk PTV, respectively. (d–f) V95% coverage for high‐, mid‐, and low‐risk PTV. Points indicate outliers.