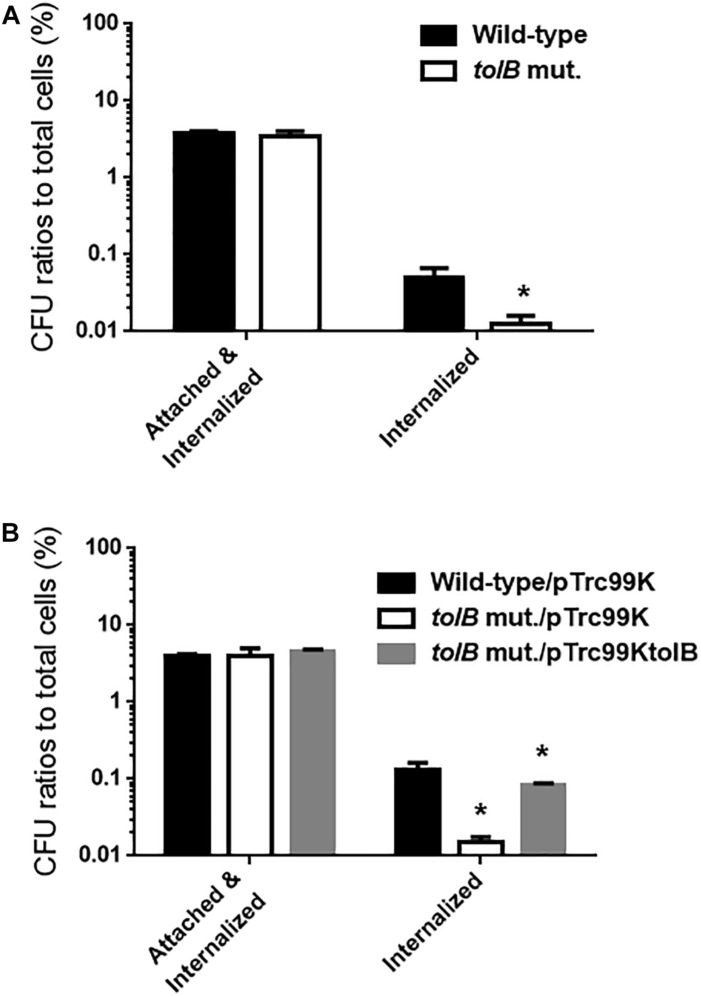
FIGURE 2.
Adhesion to and internalization of bladder epithelial cells (HTB-9) for the wild-type parent and the tolB mutant (A) or the wild-type parent and the tolB mutant carrying pTrc99K (empty vector) or pTrc99KtolB (tolB expression plasmid) (B). Y-axis on the graphs shows percent (%) of CFU (colony forming units) values of adhered and internalized bacteria relative to total bacterial cell numbers. Data plotted are the means from three independent experiments; error bars indicate the standard deviations, *P < 0.01. Asterisks denote significance for values relative to the wild-type control.

