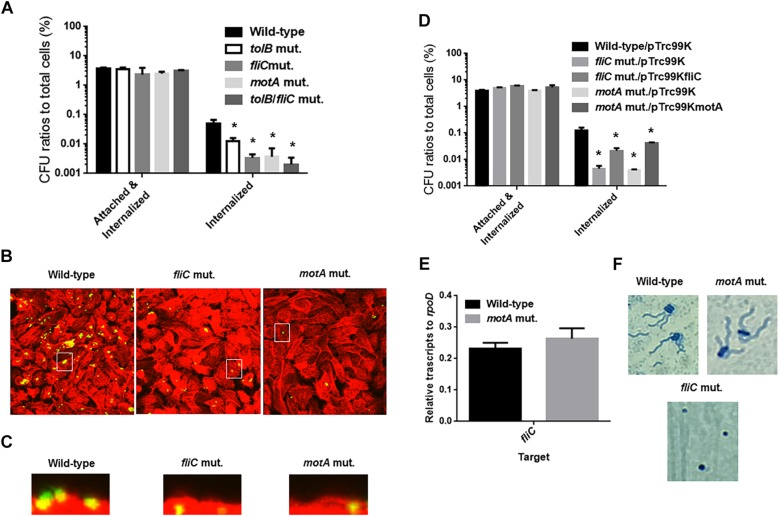
FIGURE 6.
Adhesion to, internalization of and aggregation within bladder epithelial cells (HTB-9) for the wild-type parent, and the tolB, fliC, and motA mutants, or wild-type parent and mutants carrying pTrc99K (empty vector), pTrc99KfliC (fliC expression plasmid) or pTrc99KmotA (motA expression plasmid). Y-axis on the graphs shows percent (%) of CFU (colony forming units) values of adhered and internalized bacteria relative to total bacterial cell numbers (A,D). Data plotted are the means from three independent experiments; error bars indicate the standard deviations *P < 0.01. Asterisks denote significance for values relative to the wild-type control. Fluorescent images of aggregated UPEC cells within bladder epithelial cells (HTB-9). Bacteria carrying a Green fluorescence protein (GFP) expression plasmid, pTurboGFP-B and HTB-9 stained with rhodamine-phalloidin were imaged as, respectively, green and red fluorescent colors on the microscopy using 60× objective. Overlooking images (B) and cross sectional images in the white box indicated in panel B (C) were acquired for each sample. The experiment was repeated twice and similar results were obtained. Transcript levels of fliC gene in the wild-type parent and the tolB mutant (E). Transcript levels were described as relative values to that of rpoD (housekeeping gene). Data plotted are the means of two biological replicates, error bars indicate the ranges. Flagella and bacteria cells stained with Victoria blue/Tannic acid were pictured on the microscopy using 100× objective (F).

