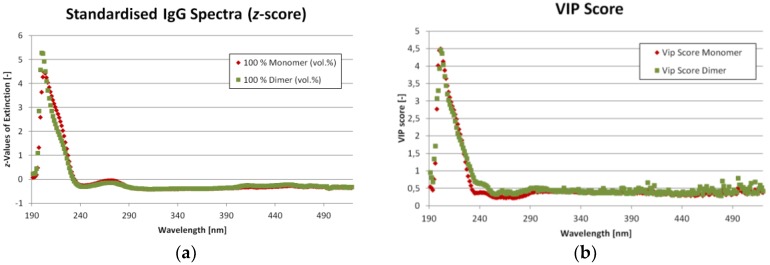
Figure 5.
(a) Ultraviolet/Visible light (UV/VIS) spectra of the trainings data with the highest and lowest Immunoglobulin G (IgG) monomer content. The red dots represent the mixture with 100 vol.% monomer, the green dots with 100 vol.% dimer, respectively. However, this does not mean pure monomer or dimer since a conversion from one into the other takes place; (b) Variable Importance on Projections (VIP) scores for monomer (red) and dimer (green).

