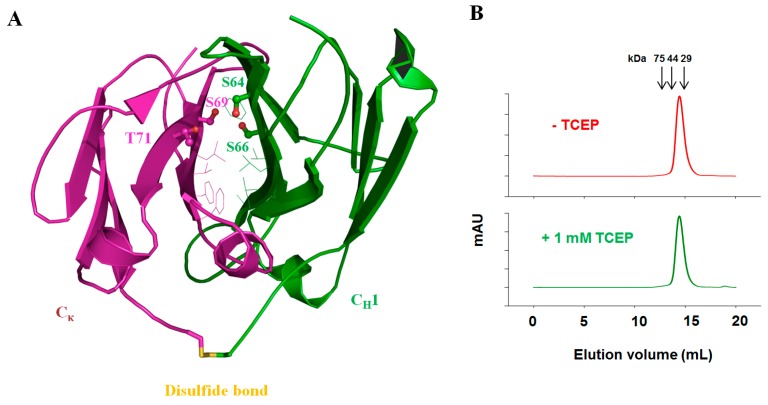
Figure 5.
Rational design and identification of stabilized CH1–Cκ. (A) Structural analysis of the CH1–Cκ interface. The side chains of hydrophobic residues at the interface are shown in slim stick representation. The four amino acid residues lining a void structure are indicated with their side chains shown in a bold ball-and-stick representation; (B) Size-exclusion chromatography of mD1.22-CH1/m36.4-CL variants. Proteins were treated with and without 1 mM TCEP (tris(2-carboxyethyl)phosphine) before analysis. The arrows at the top indicate the elution volumes of the molecular mass standards in PBS (pH 7.4): carbonic anhydrase (29 kDa), ovalbumin (44 kDa) and conalbumin (75 kDa).

