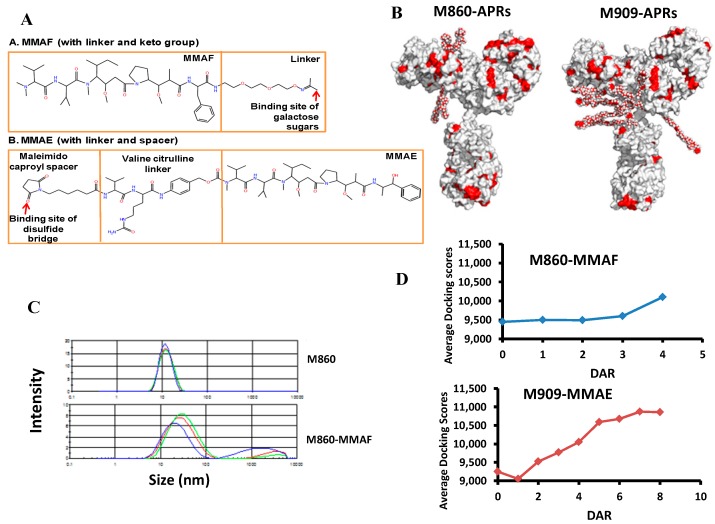
Figure 6.
The aggregation of ADC. (A) The chemical structures of monomethyl auristatin F (MMAF) and E (MMAE) and their respective linkers and spacers; (B) The molecular surface diagrams of antibody drug conjugates (ADCs) with the predicted aggregation-prone regions (APRs) colored in red. Homology models of the ADCs M860-MMAE and M909-MMAF have the maximum number of four drugs for M860-MMAF and eight drugs for M909-MMAE. The APRs of the antibody are the consensus residues predicted by four combinations of calculation programs, Aggrescan, TANGO, WALTZ and Amylpred2. The APRs of the drug molecules are the nonpolar carbon atoms; (C) The aggregation tendencies of M860 mAb and M860-ADC measured using the dynamic light scattering test to determine the size distribution profile after seven days of incubation at 4 °C and 37 °C (1 mg/mL of PBS buffer). (D) The docking scores of M860-MMAF and M909-MMAE with drug-antibody ratios (DARs). The average docking scores of M860-MMAF and M909-MMAE were simulated and calculated using PatchDock.

