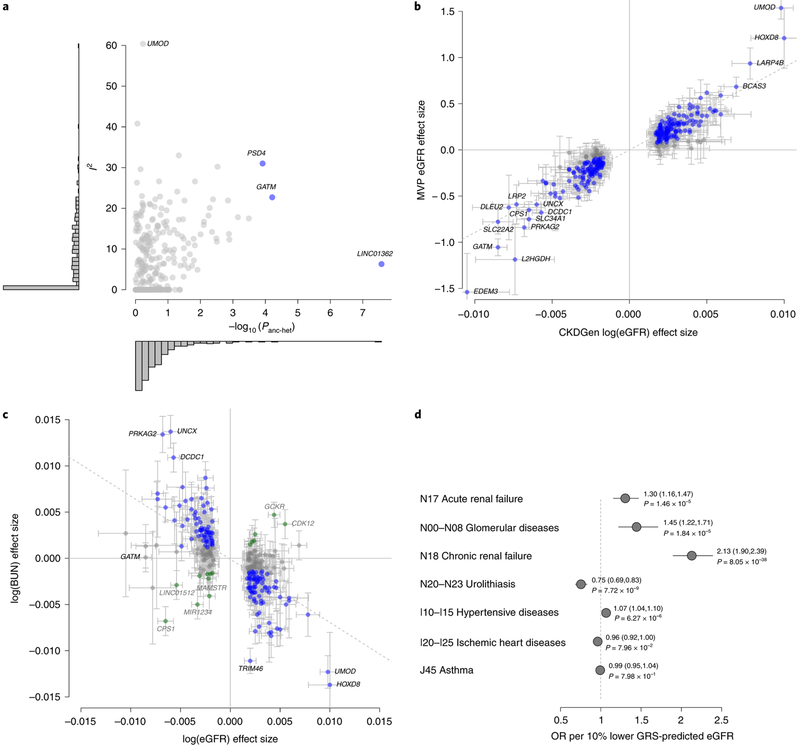
Fig. 2 |. Generalizability with respect to other populations and other kidney function markers.
a, Measures of heterogeneity for the 308 eGFR-associated index SNPs. Each variant’s heterogeneity quantified as I2 from the trans-ancestry meta-analysis (y axis) is compared to the ancestry-related heterogeneity from meta-regression (−log10(Panc-het); x axis). Histograms summarize the distribution of the heterogeneity measures on both axes. SNPs with ancestry-related heterogeneity (Panc-het<1.6×10−4 = 0.05/308) are marked in blue and labeled; SNPs with I2>50% are labeled. b, Comparison of genetic effect estimates between CKDGen Consortium discovery (x axis) and MVP replication (y axis). Blue font indicates one-sided P<0.05 in the MVP. Error bars correspond to 95% CIs. The dashed line corresponds to the line of best fit. Pearson’s correlation coefficient r = 0.92 (95% CI = 0.90, 0.94). c, The magnitude of genetic effects on eGFR (x axis) as compared to BUN (y axis) for the 264 replicated eGFR-associated index SNPs. Color coding reflects evidence of kidney function relevance (Methods), which is coded as ‘likely’ (blue), ‘inconclusive’ (gray) or ‘unlikely’ (green). Error bars correspond to 95% CIs. The dashed line corresponds to the line of best fit. Pearson’s correlation coefficient r=−0.65 (95% CI = −0.72, −0.58). d, Association of lower genetically predicted eGFR based on a GRS of 147 SNPs likely to be most relevant for kidney function with ICD-10-based clinical diagnoses for 452,264 individuals from the UK Biobank. Asthma was included as a negative control. Results are displayed as the OR and 95% CI per 10% lower GRS-predicted eGFR (Methods).

