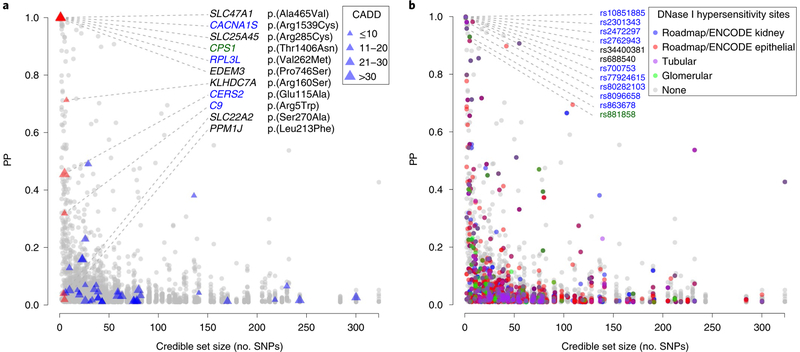
Fig. 4 |. credible set size plotted against variant posterior probability for 3,655 sNPs in 253 99% credible sets according to variant annotation.
a, Exonic variants. SNPs are marked by triangles, with triangle size proportional to CADD score. Red triangles indicate missense SNPs mapping to small credible sets (≤5 SNPs) or to sets containing SNPs with high individual PP of driving the association signal (>50%). b, SNPs with regulatory potential. Symbol color corresponds to regulatory potential as derived from DNase I hypersensitivity analysis in target tissues (Methods). Annotation was restricted to variants with PP>1%; SNPs with PP≥90% contained in credible sets with ≤10 SNPs are labeled. Data are plotted as credible set size (x axis) against variant PP(y axis). Blue and green color coding for gene and SNP labels refers to kidney-function relevance and has the same meaning as in Fig. 2.

