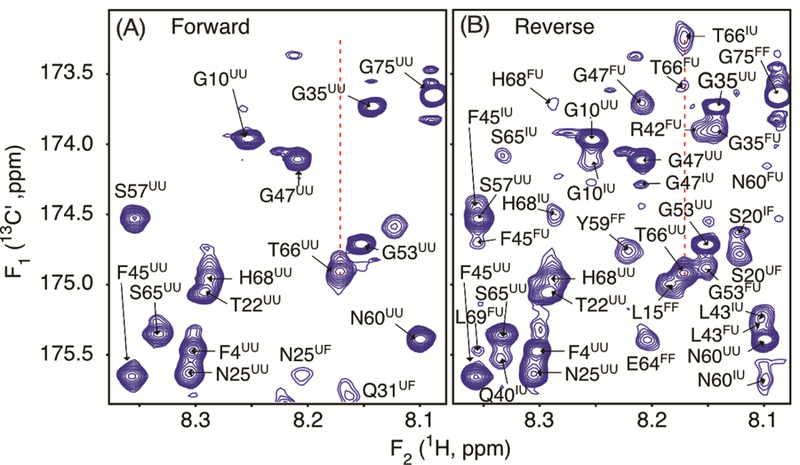
Figure 3.

Small regions of the 600 MHz (A) forward and (B) reverse sampled 2D 1H-13C′ HNCO spectra of a sample containing 125 μM 15N/13C′/2H-VA2-ubiquitin, pH 6.4, 25 °C. Full spectra are shown in Figures S7 and S8. Fully analogous to the spectra of Figure 2, the forward spectrum (A) primarily shows F1 dimension correlations for unfolded protein, correlated to 2.5 kbar 1H F2 frequencies of either folded or unfolded protein. Analogously, the reverse sampled spectrum (B) shows in the F1 dimension the 1-bar 13C′ frequencies of U, I, and F species, correlated with 2.5 kbar 1H frequency of the amide of the next residue. Each peak number indicates the residue that is 13C′ labeled, with the first superscript referring to the state of the protein during 13C′ evolution at 1 bar, and the second superscript denoting the state during 1H detection at 2.5 kbar.
