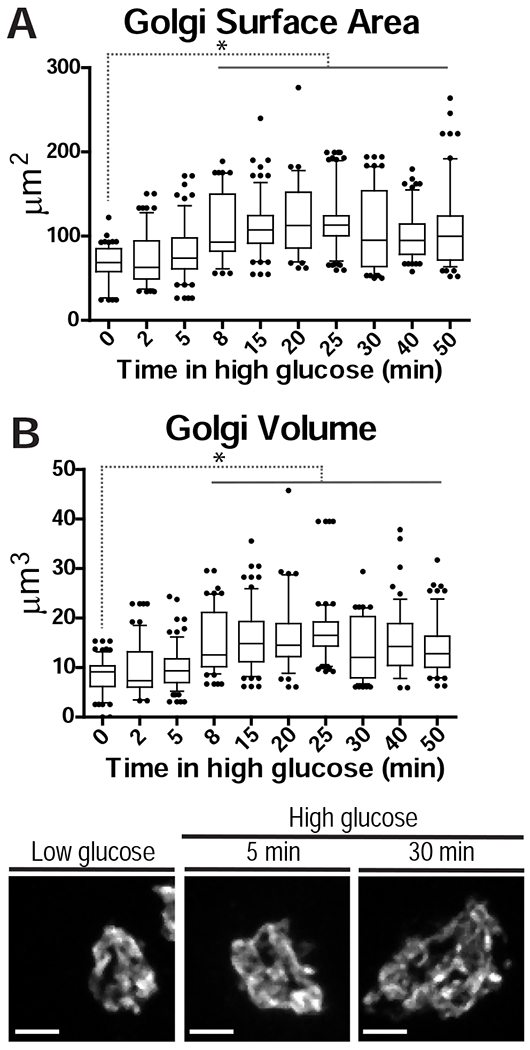
Figure 2. Golgi expands following the first phase of GSIS in MIN6 cells.

A-B) Golgi surface area (A) and volume (B) during high glucose treatment. p < 0.001, one-way ANOVA and Tukey’s multiple comparison test; n = 56-81 cells. C-E) Golgi (Giantin) at indicated high-glucose treatment times. All images are maximum intensity projections of whole-cell confocal z-stacks.
