Figure 2.

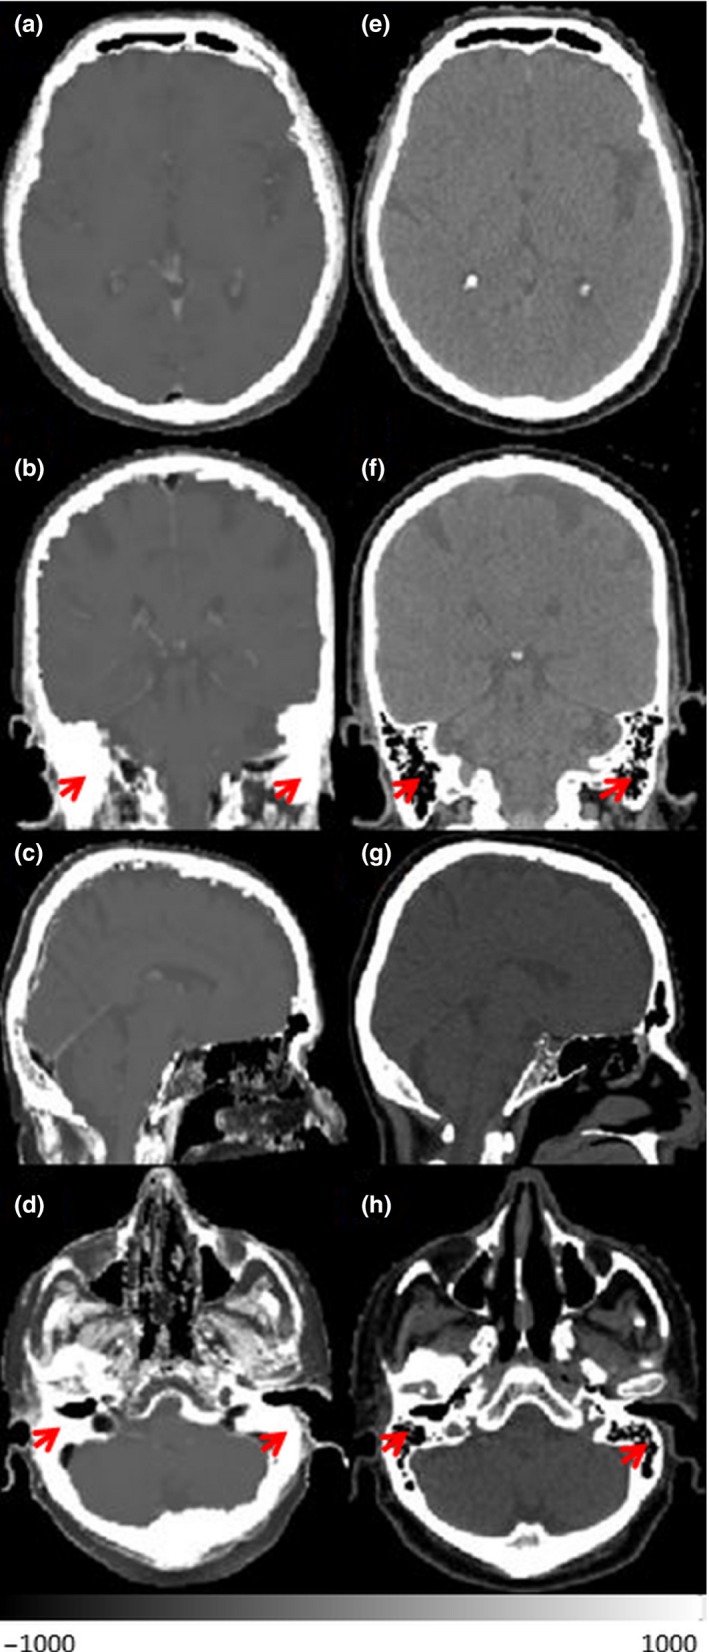
Synthetic‐CT (a–d) and corresponded CT (e–h) in three views and different axial level of one patient. Red arrows indicate mastoid sinuses

Synthetic‐CT (a–d) and corresponded CT (e–h) in three views and different axial level of one patient. Red arrows indicate mastoid sinuses