
Figure 1.
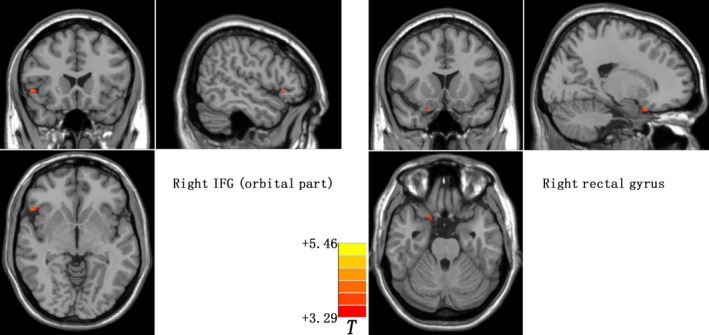
GMV differences between prodromal individuals and healthy controls. Increased GMV in the right IFG and right rectal gyrus were observed in the prodromal individuals. The color bar represents the t values of the group analysis of GMV. GMV, gray matter volume; IFG, inferior frontal gyrus