
Figure 3.
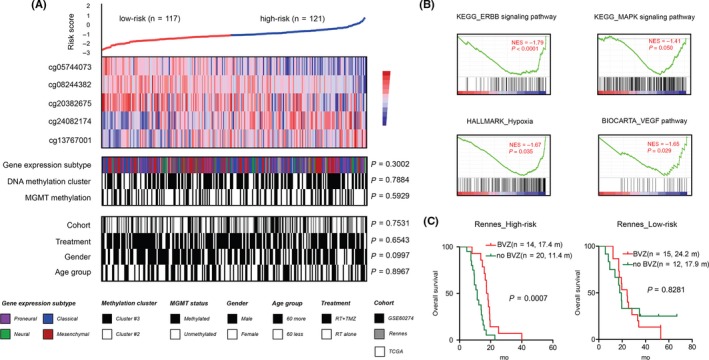
Molecular and clinical characteristics of the 5‐CpGs miRNA methylation signature. A, the heat maps of K‐means (k = 2) clustering on the 5‐CpGs methylation signature according to the M‐value from all GBM groups; each column represented a sample; for each sample (n = 238), subgroup correlation was indicated; P values for Fisher' exact test and chi‐square test were accordingly shown; B, GSEA enrichment plots for representative functional gene sets enriched in high‐risk tumors from TCGA. C, High‐risk but not low‐risk tumors conferred significant OS benefits when treated with bevacizumab in Rennes cohort with available second‐line therapies