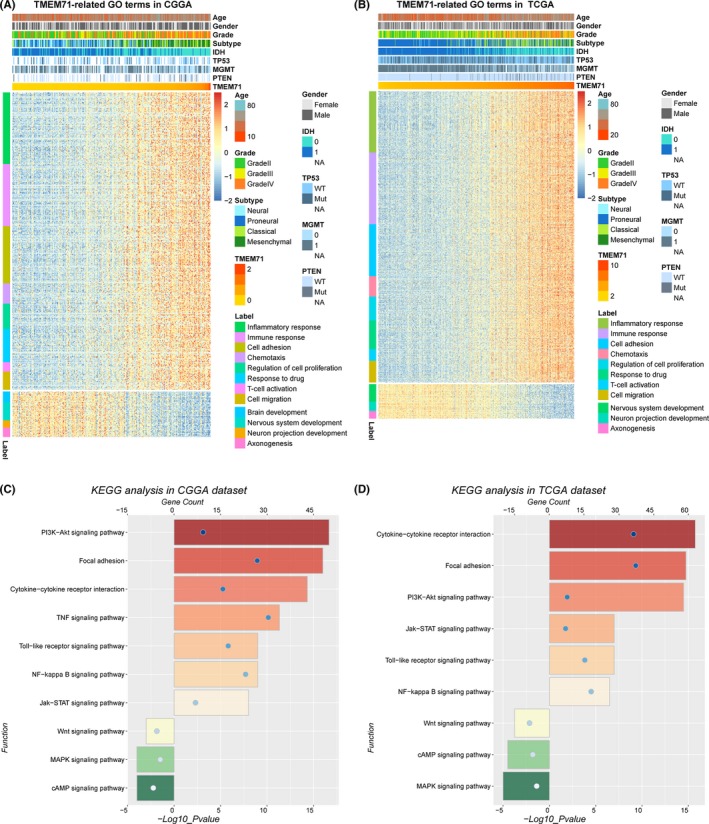
Figure 5.

Biological function and pathway analysis in CGGA and TCGA datasets. (A‐B) Gene ontology analysis of TMEM71 expression in glioma. The samples were ranked according to TMEM71 expression from low to high. (C‐D) KEGG analysis of TMEM71 expression in glioma. The bar charts represented the count and the circle represented the P value. The color also represented the count
