
Figure 2.
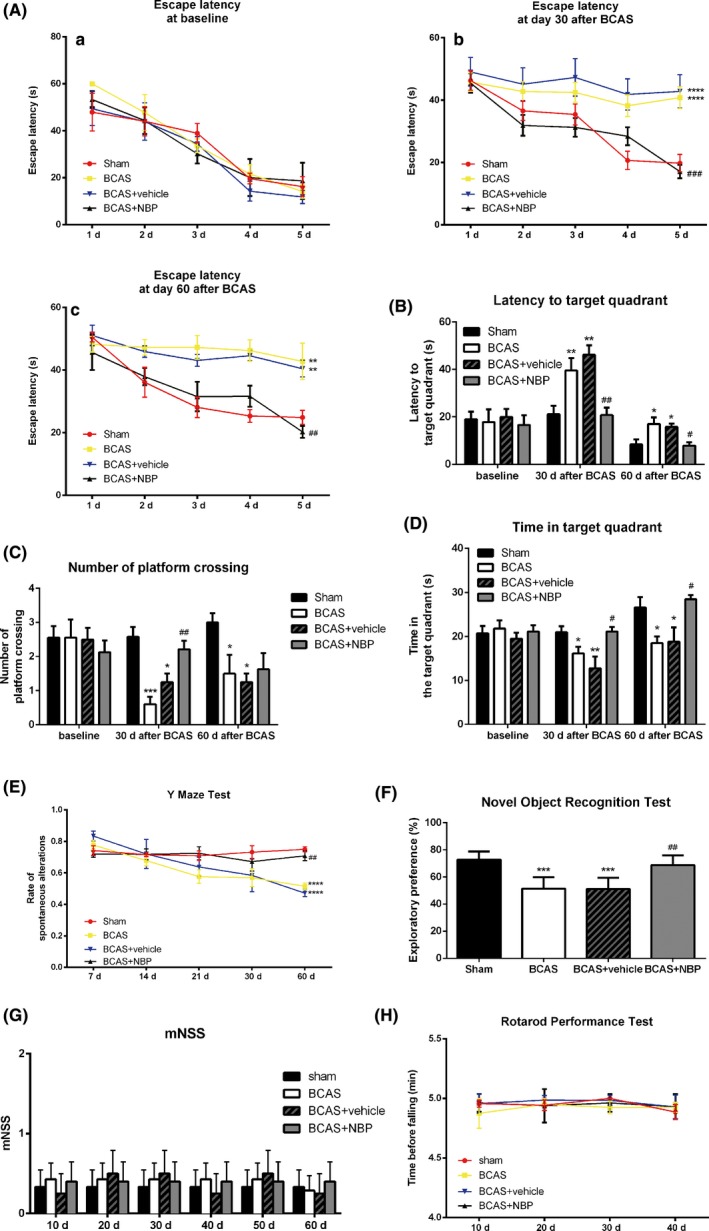
NBP ameliorated cognitive impairment after BCAS. A, The escape latency of mice during the acquisition phase of Morris water maze test at different time points. B, C, D, The latency to the target quadrant, the frequency of platform crossing and the time spent in target quadrant in the probe test of Morris water maze test at different time points. E, The percentage of spontaneous alterations in the Y‐maze test at different time points. F, The exploratory preference the novel object recognition test at day 60 after BCAS. G, The modified neurological severity score (mNSS) at different time points. H, The time before falling in the rotarod performance test at different time points. All data are presented as mean ± SEM (n = 10/group). *P < 0.05, **P < 0.01, ***P < 0.005, ****P < 0.001, compared with sham group; #P < 0.05, ##P < 0.01, ####P < 0.001, compared with BCAS group