
Figure 4.
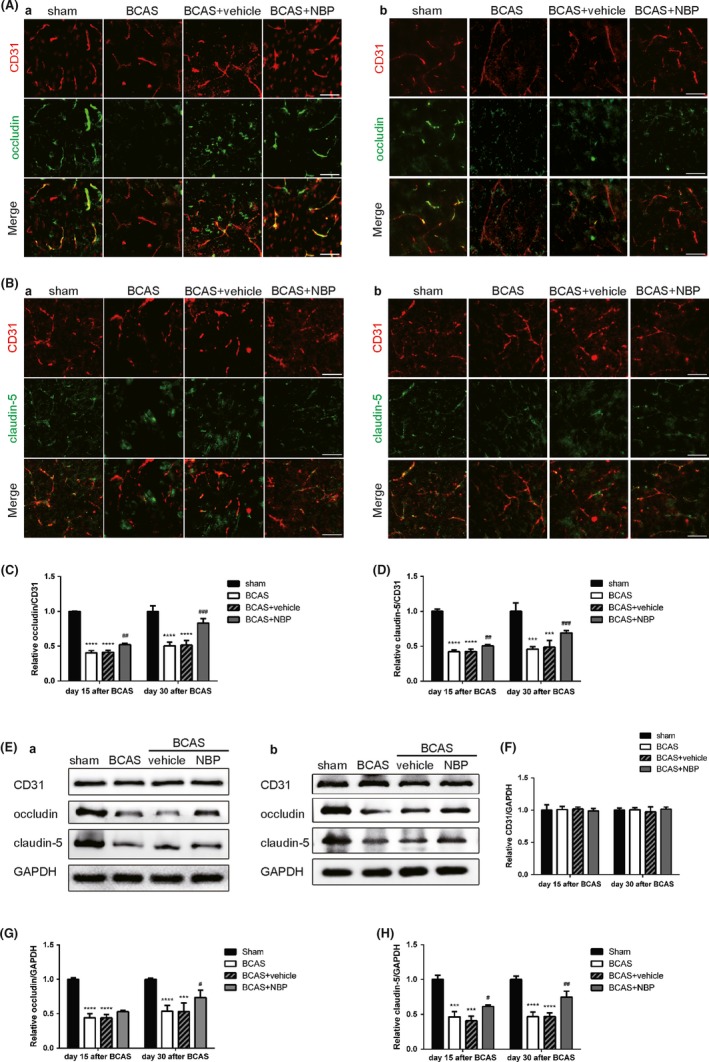
NBP reduced damage of endothelial tight junctions after BCAS. A, Immunofluorescent images of occludin (green)/CD31 (red) colocalization at day 15 (a) and day 30 (b) after BCAS. Scale bar: 50 μm. B, Immunofluorescent images of claudin‐5 (green)/CD31 (red) colocalization at day 15 (a) and day 30 (b) after BCAS. Scale bar: 50 μm. C, Quantification of immunofluorescent intensity of occludin to CD31 area (n = 4/group). D, Quantification of immunofluorescent intensity of claudin‐5 to CD31 area (n = 4/group). E, Representative immunoblots probed with antibodies against CD31, occludin, claudin‐5 and GAPDH at day 15 (a) and day 30 (b) after BCAS. F, Quantification of the levels of CD31 normalized to GAPDH (n = 4). G, Quantification of the levels of occludin normalized to GAPDH (n = 4). H, Quantification of the levels of claudin‐5 normalized to GAPDH (n = 4). All data are presented as mean ± SEM. ***P < 0.005, ****P < 0.001, compared with sham group; #P < 0.05, ##P < 0.01, ###P < 0.005, compared with BCAS group