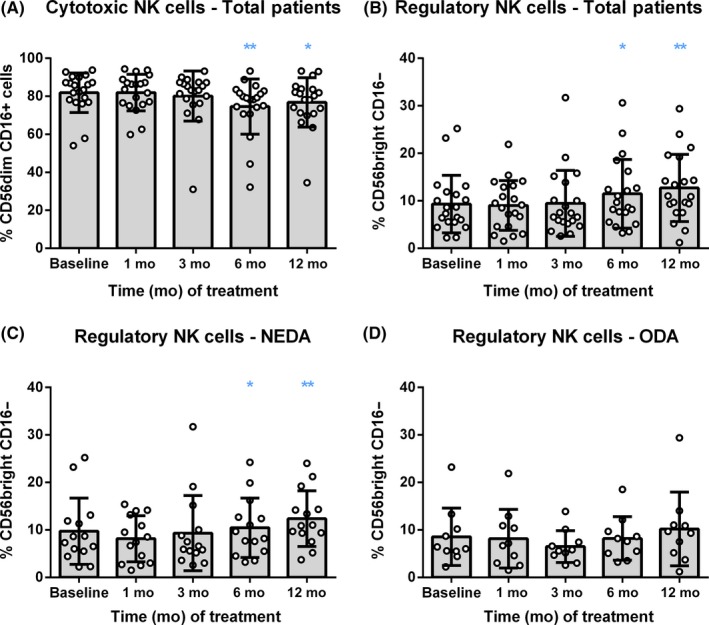
Figure 5.

DMF shifted the balance from cytotoxic to regulatory NK cells. Representation of percentage (%) of cytotoxic (CD56dim CD16+) and regulatory (CD56bright CD16‐) natural killer (NK) cells (A and B, respectively), before the treatment (Baseline) and after 1, 3, 6, and 12 months of follow‐up in total RRMS patients (n = 22); and regulatory NK cells in NEDA (n = 15) (C) and ODA (n = 6) (D) patients. Data are expressed as mean SD. Each dot represents the value of an individual. *P < 0.05 and **P < 0.01
