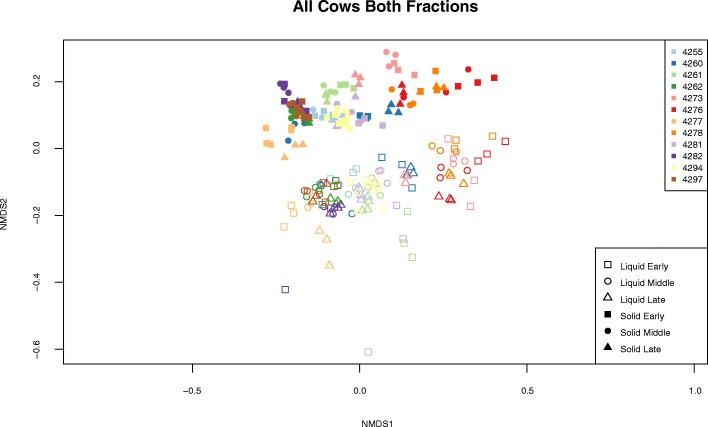
Fig. 1.
Non-metric multidimensional scaling plot of the ruminal solid and liquid phase microbiota from 12 lactating dairy cows sampled during early, middle, and late periods of their first lactation cycle. Distances were calculated using the Bray-Curtis dissimilarity index. Points are plotted based on individual cow, period of lactation, and type of sample

