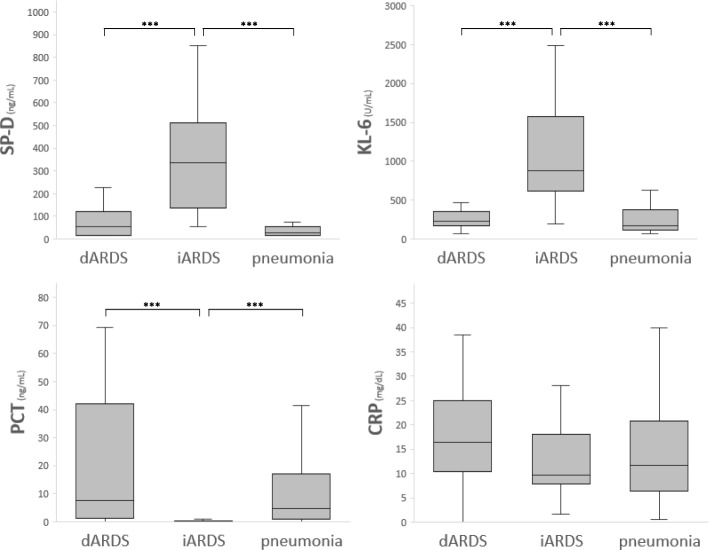
Fig. 4.
Biomarkers of infection or epithelial injury on the day of admission for patients with iARDS, dARDS, or pneumonia. Box plot shows the median levels of biomarkers with interquartile ranges. The whiskers denote the maximum and minimum values within the 1.5 times interquartile ranges. PCT, procalcitonin; CRP, C-reactive protein; SP, surfactant protein. The Steel–Dwass test was used for multiple pairwise comparisons. ***P < 0.001

