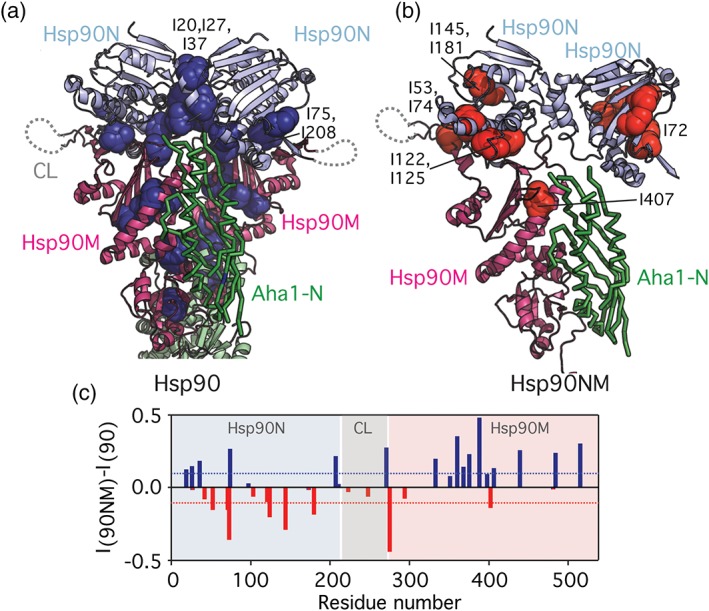
Figure 2.

Discrimination between allosteric changes (a) and cis binding (b). (a) Mapping of residues that are more affected in the Hsp90/Aha1‐complex compared to the Hsp90NM/Aha1‐interaction (dark blue spheres, blue bars in c) on the structure of the closed Hsp90 dimer. (b) Residues that are more affected in the Hsp90NM/Aha1‐interaction when compared to the Hsp90/Aha1‐complex (red bars in c) are displayed with red spheres on Hsp90NM. To allow better comparison with panel (a), a second Hsp90N domain is displayed (as observed in the closed Hsp90 dimer; Figure 1c), as well as the N‐terminal domain of Aha1 (green). Labeled residues are mentioned in the text. (c) Comparison of Hsp90/Aha1‐ with Hsp90NM/Aha1‐interaction. (I/I 0) ratios of Hsp90 isoleucine residues upon Aha1 interaction (Figure S1b) were subtracted from (I/I 0) values observed for the Hsp90NM/Aha1‐interaction (Figure S4c; both at a molar ratio of 1:4). Positive values (blue bars) indicate isoleucine residues, which were more strongly broadened in full‐length Hsp90 upon addition of Aha1 (Hsp90/Aha1‐interaction), whereas negative values (red bars) indicate residues that were more strongly attenuated in Hsp90NM upon addition of Aha1 (Hsp90NM/Aha1‐interaction). Blue and red bars correspond to highlighted residues in (a, b)
