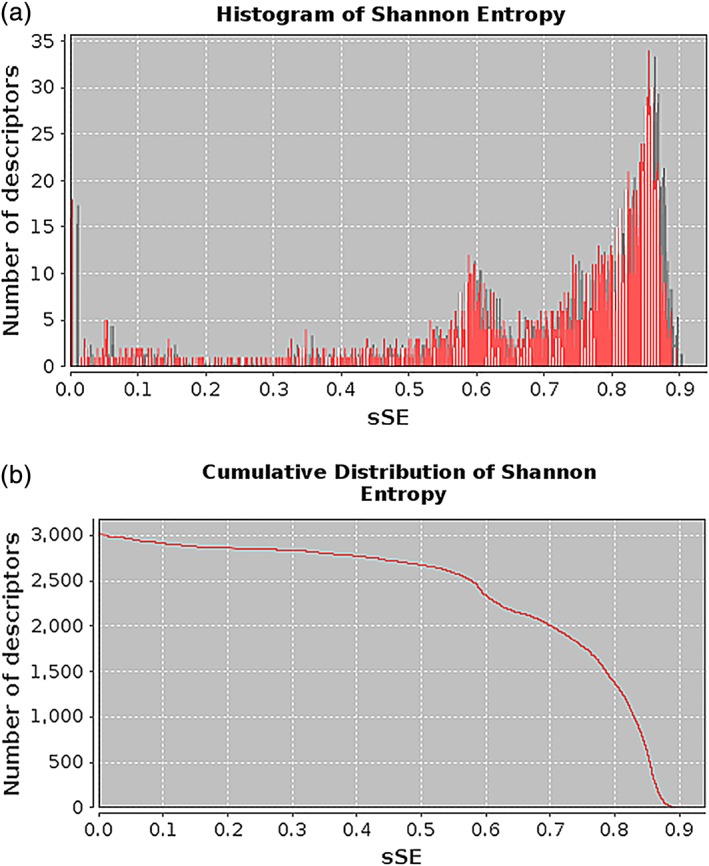
Figure 4.

Illustration of the information content plots derived from a set of 3,000 descriptors calculated with ProtDCal. (a) A frequency histogram per interval of standardized Shannon entropy (sSE) is presented. (b) The cumulative frequency along the range of sSE is depicted
