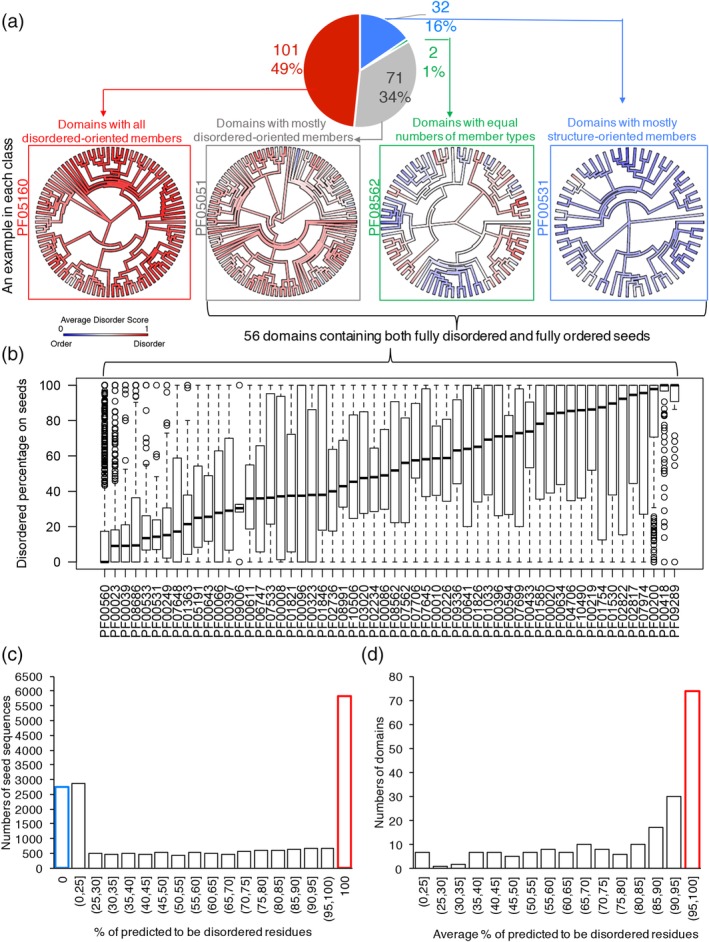
Figure 2.

Significant diversity of predicted disorder among the homolog sequences within PDDs. (a) The pie chart showing the numbers and percentage of domains having different compositions of seed members. In each group, examples were presented as the Pfam phylogenetic trees mapped with average VSL2b disordered score into each sequence. (b) A set of 56 PDDs having both 100% predicted‐to‐be‐disordered and 100% predicted‐to‐be‐structured members. The distribution of predicted disorder percentage for each domain is shown as boxplots. (c) Distribution of predicted disorder percentage of all the 19,577 seeds. (d) Distribution of average predicted disorder percentage for 206 domains. PDD, probable disordered domain; VSL2B, disorder predictor trained on V = variously characterized proteins with S = short and/or L = long IDRs, version 2b
