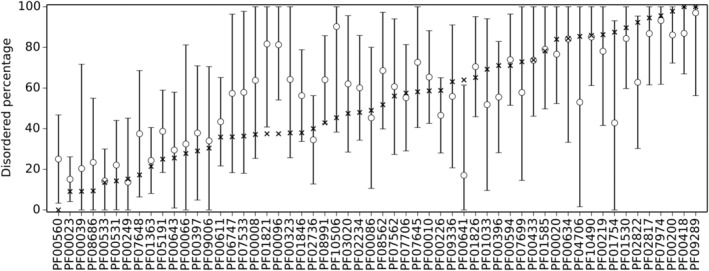
Figure 3.

Estimated disorder content of the last common ancestor of each of the 56 PDDs having both 100% predicted‐to‐be‐disordered and 100% predicted‐to‐be‐structured members. The estimated percentage disordered residues of the ancestor (circles) and the 95% confidence interval of the estimate (error bars) are plotted along with the median percentage disordered residues (X) for comparison. PDD, probable disordered domain
