
Figure 4.
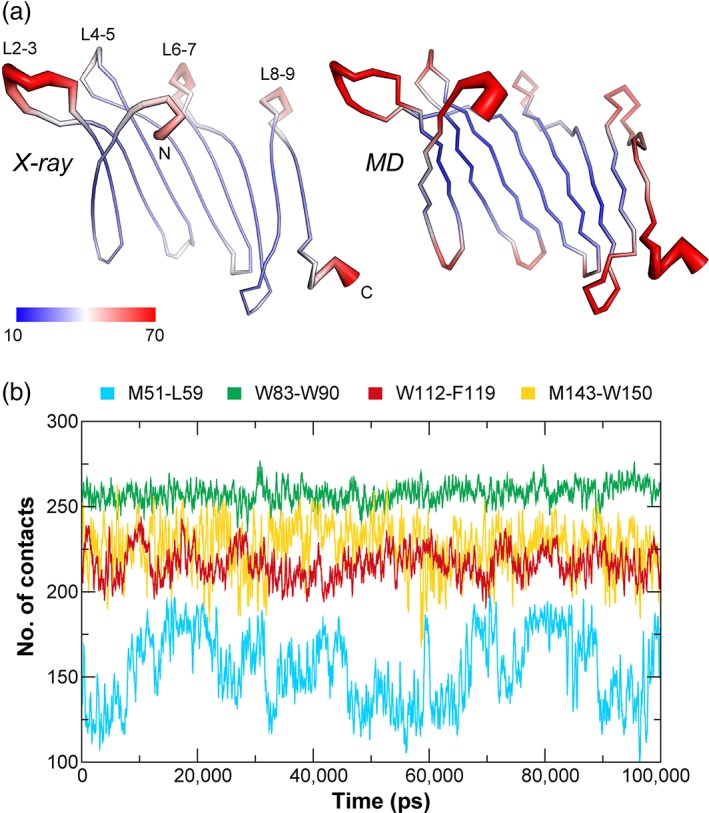
Dynamics of BfSLBP. (a) Mapping of B‐values (left) and computed B‐values derived from MD simulations (right) onto the BfSLBP structure. The molecule is colored in a gradient from blue (low B‐value, thin line) to red (highest B‐values, thick line). (b) Number of contacts between the hydrophobic pair of each up hairpin during the course of a 100 ns MD simulation (with a running average over 200 ps). A “contact” is counted if the distance between two atoms, one from each group, is less than 6 å