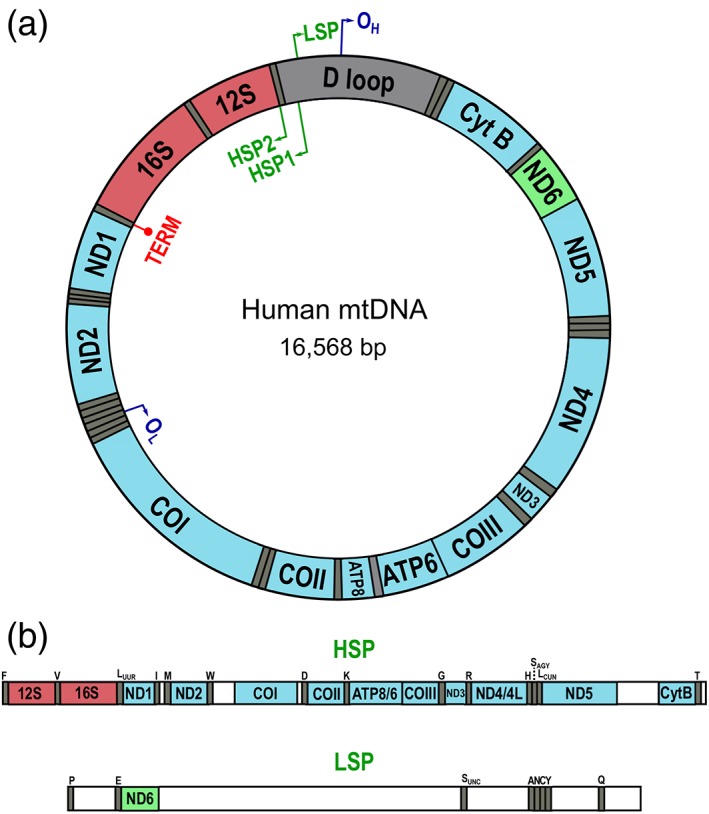
Figure 1.

Organization of mitochondrial transcription. (a) Scheme of the mitochondrial genome indicating key functional loci as well as the different gene products. rRNAs (red) and most mRNAs (blue) are coded in the H‐strand, while a single mRNA (ND6; green) is coded by the L‐strand. tRNA genes are show in gray. (b) Scheme of the full‐length polycistronic mitochondrial transcripts indicating the gene products encoded by each transcript
