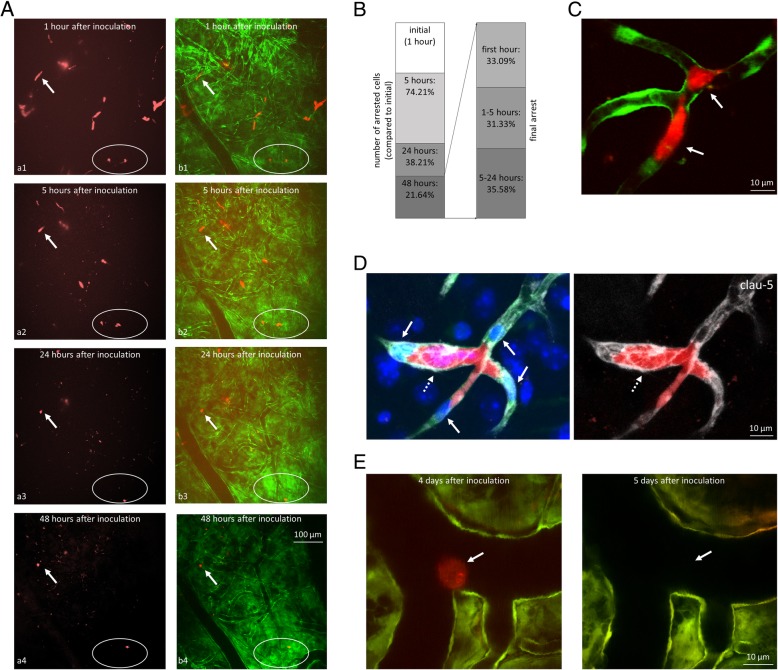
Fig. 1.
Arrest of breast cancer cells in the cerebral vasculature. a: Representative two-photon microscopy z-projection images of tdTomato-4T1 cells arrested in the cerebral microvasculature of FVB/Ant:TgCAG-yfp mice. The same region of the same mouse was imaged at all time points. a1-a4: tdTomato-4T1 cells; b1-b4: merged red (tdTomato-4T1) and green (Venus-YFP-labelled endothelial cells) channels. Arrow indicates the same cell at all time points. Encircled region shows cells changing position. b: Quantitative representation of breast cancer cells arrested in the brain 1 h, 5, 24 and 48 h after inoculation (first panel). Percentage of surviving cells finding the final position in the vascular lumen in the first hour, between 1 and 5 h and between 5 and 24 h (second panel). N = 3 animals, n = 3 brain regions (500 · 500 · 250 μm3 x · y · z) of each animal. c: Representative two-photon micrograph (z-projection) of tdTomato-4T1 cells arrested at a vascular branching point in the parietal cortex (5 h after inoculation). Arrows indicate elongated tumour cells. d: Claudin-5 immunostaining (grey) at 4 days after the injection of tdTomato-4T1 cells into the circulation of mice having Venus-YFP-labelled endothelial cells; confocal z-projection. Arrows indicate endothelial nuclei protruded into the lumen; dashed arrow shows dilated capillary. e: Tumour cell arrested in a pial artery in two-photon micrographs (z-projections) captured at 4 and 5 days after inoculation, respectively. Red = tumour cells (tdTomato), green = endothelium (YFP), blue = nuclei (Hoechst)

