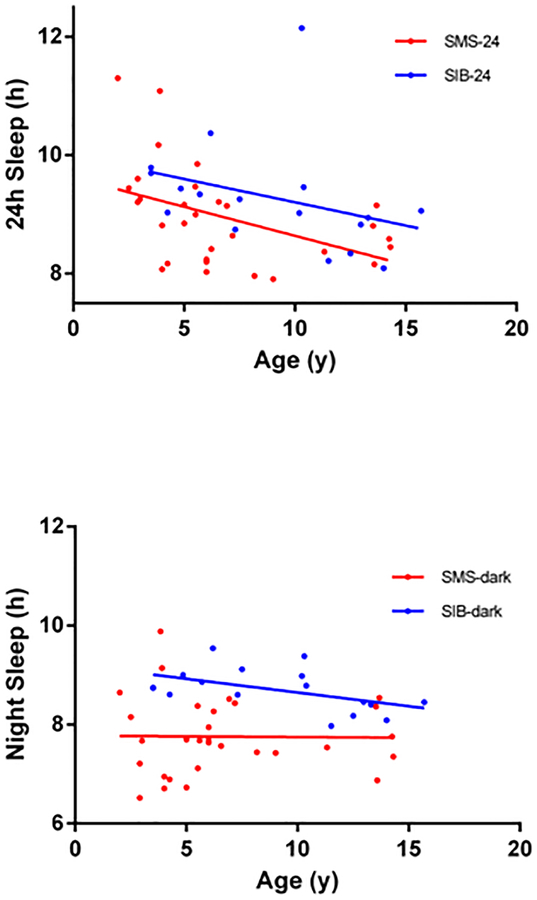
Figure 2:
Panel A (top): The regressions of age on activity-estimated 24h sleep are shown for the SMS group (red line, circles, n=30, under age16y) and for SIB group (blue line, circles, n=17). The y intercepts of the two regression lines are significantly different (p=0.037) but not the slopes (pooled slope=0.0908). Panel B (bottom): The regressions of age in activity-estimated night-sleep are shown for the same groups as above. As above, the y intercepts, of the two lines are significantly different (p<.0001) but not the slopes (pooled slope= 0.022).
Color figure can be viewed in the online issue, which is available at http://onlinelibrary.wiley.com_

