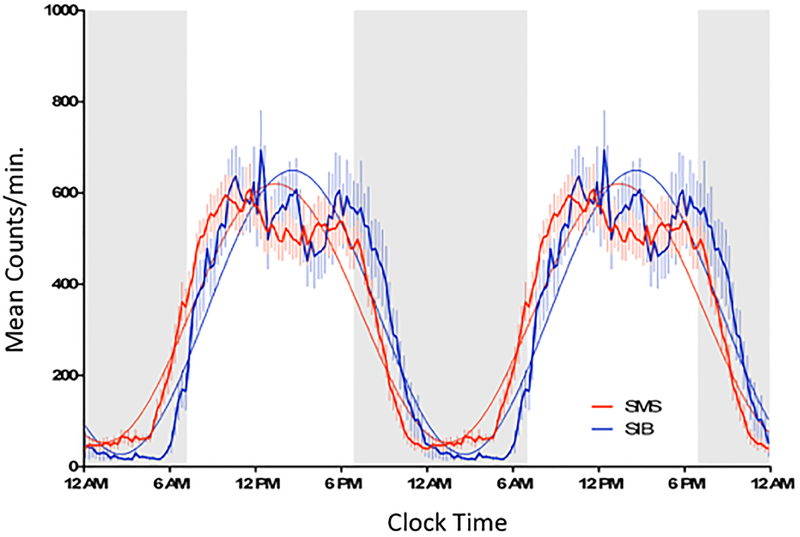
Figure 3:
The average (15 minute mean ±sem) 24 hour patterns from ten days of wrist activity are shown for SMS (n=22) and SIB (n=10). The 24-hour interval is plotted twice to enable viewing a continuous 48-hour pattern of activity and the transitions between episodes of rest and activity. The shaded area between 7 PM and 7AM represents the time interval when AES and SDA analysis of the activity pattern were conducted. The 24 hour activity pattern of the SMS group is shifted to the left relative to the SIB group.

