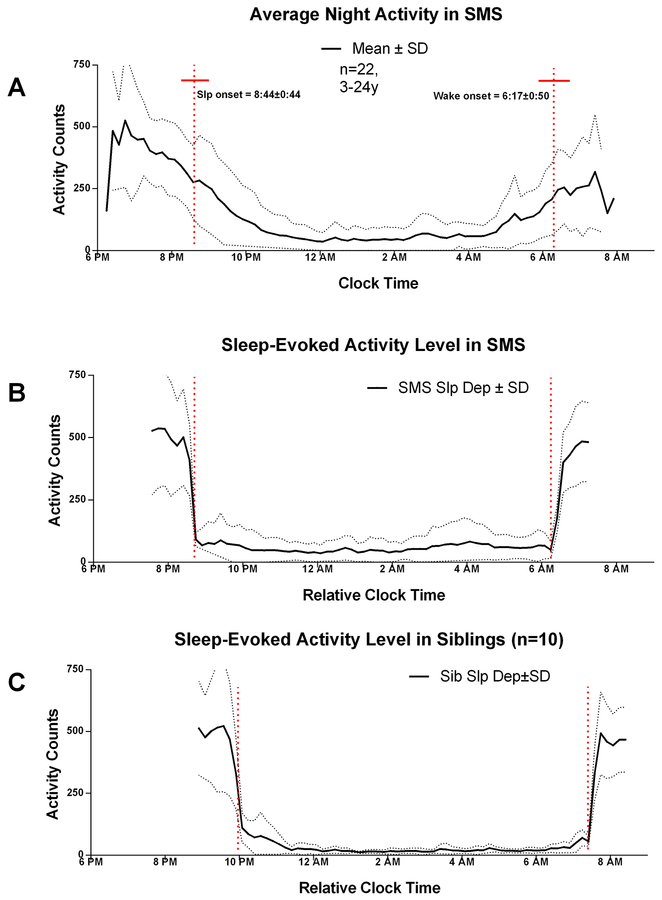
Figure 5:
The relationship between external (clock) and internal (sleep onset) averaged night-time wrist activity in SMS. Panel A: Clock time averaged night activity level in SMS (mean: solid line ± sem: dashed lines; n=22; 2.5–24 y). Panel B: Sleep-onset/offset averaged night activity in SMS (n=22; 2.5–24 y). The red vertical dashed lines indicate the time of sleep onset (8:44 pm ±0:44 and wake onset (6:17 am ± 0:50). The red horizontal bar corresponds to the SEM of sleep onset and offset times. Panel C: Sleep-onset/offset averaged night activity in SIB (n=10; age 3.5–15.7 years). Color figure can be viewed in the online issue, which is available at http://onlinelibrary.wiley.com_

