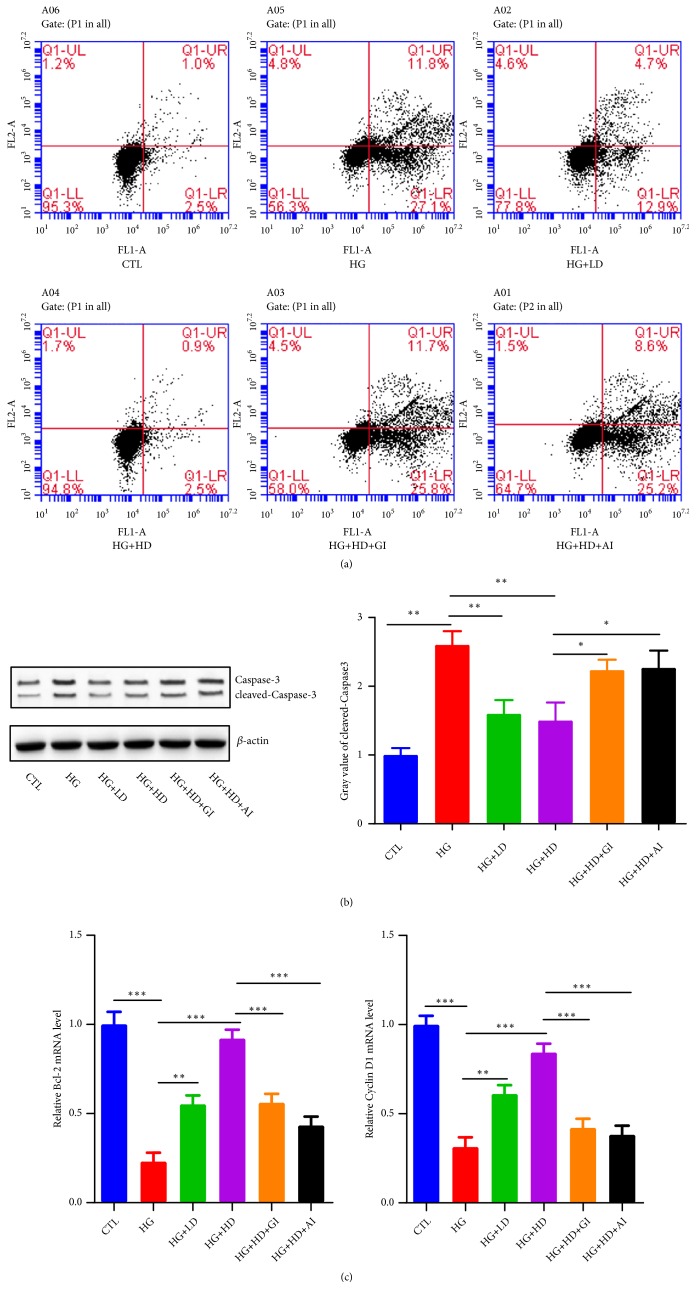
Figure 3.
The cellular apoptosis in NIT-1 cells. NIT-1 cells were cultured with rats' serums containing high dose or low dose of DJC for 24h; then, they were additionally treated with 1∗10−5 mmol·L−1 GLP-1 receptor inhibition or 5umol·L−1 AKT inhibition for another 24h. (a) Annexin V-FITC/PI staining for flow cytometry sorting, the upper left quadrant (UL) represented dead cells, left lower quadrant (LL) represented normal cells, upper right quadrant (UR) represented early apoptosis cells, the lower right quadrant (LR) represented the late apoptotic cells; Apoptosis%=UR+LR; (b) the protein levels and grey value statistics of caspase and cleaved caspase-3; (c) Q-PCR analysis of Bcl-2 and Cyclin D1 mRNA level changes. Each group was independently repeated for three times. Data were shown as Mean ± SD. ∗p<0.05, ∗∗p<0.01, ∗∗∗p<0.001.

