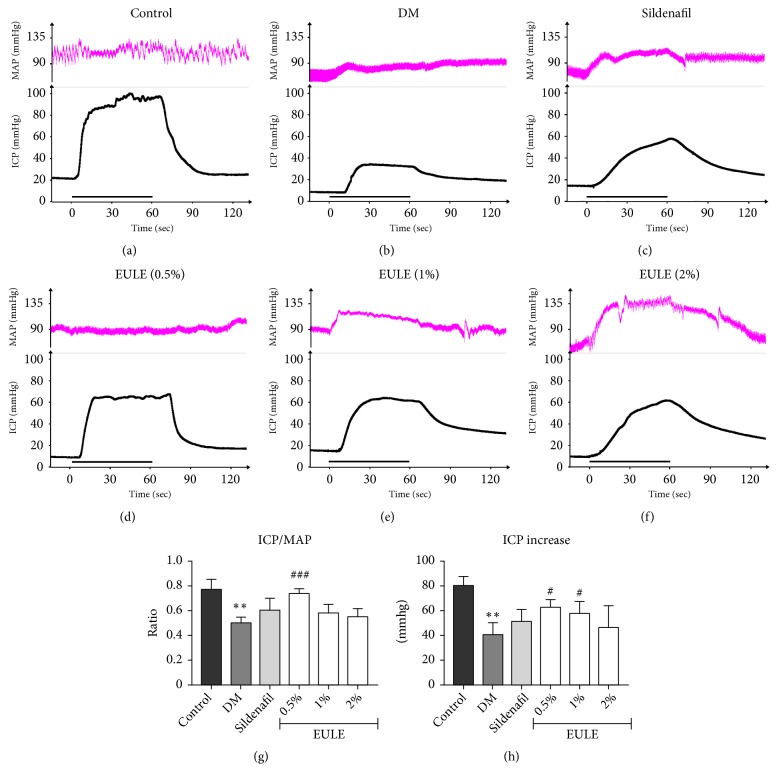
Figure 2.
Effect of EULE on erectile function. (a-f) Curves of MAP and ICP upon electrical stimulation of the CN. The stimulus interval is indicated by a straight black line. (g-h) ICP/MAP ratios and ICP values upon electrical stimulation of the CN in each experimental group. The ICP increase was determined by subtracting the resting ICP from the peak ICP. The data are presented as the mean ± SEM. ∗∗ p < 0.01 versus the control group; # p < 0.05 and ### p < 0.001 versus the DM group (n = 5 in each group, replicated 3 times).

