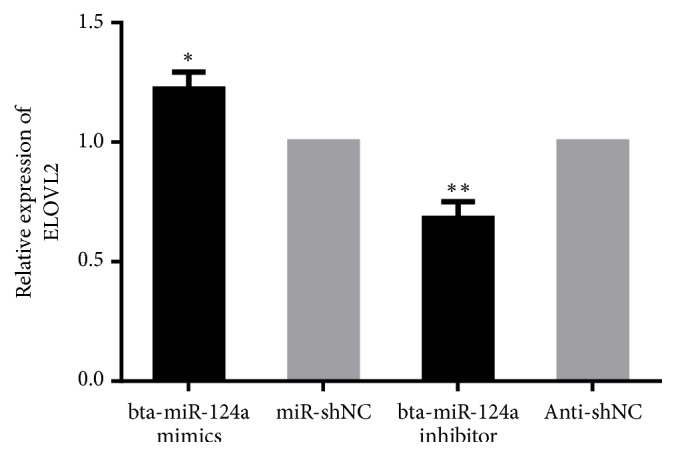
Figure 4.

Expression of ELOVL2 after the overexpression and inhibition of bta-miR-124a in Mac-T cells: mRNA level of ELOVL2 after treatment with bta-miR-124a mimics and control group (miR-NC) in Mac-T cells. mRNA level of ELOVL2 during treatment with bta-miR-124a inhibitors and control group (Anti-NC) in Mac-T cells (∗p <0.05, ∗∗p <0.01).
