Figure 3.
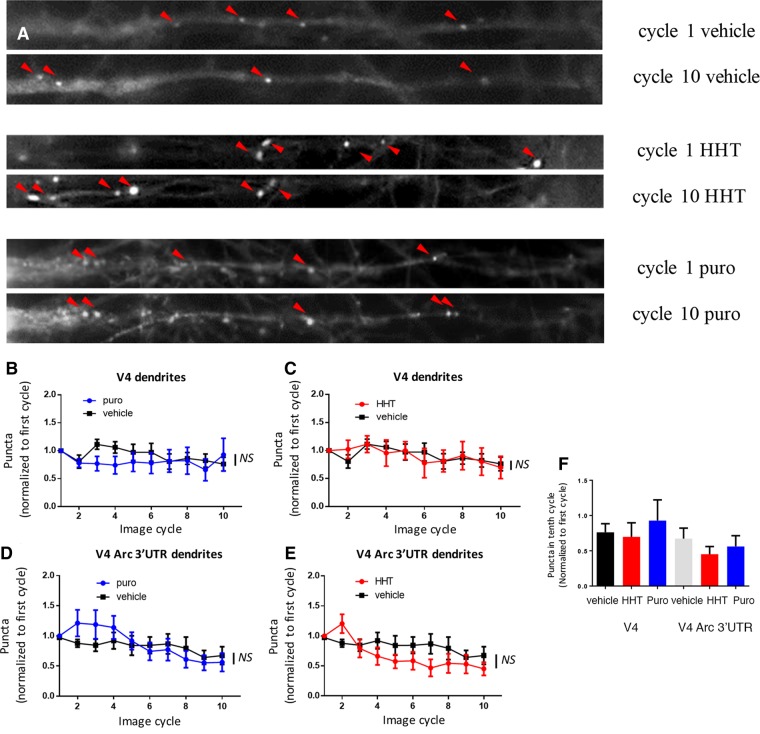
Translation visualization in neuronal dendrites. (A) Neuronal somas: from top to bottom: vehicle, HHT and puromycin at first image cycle after treatment (top) and tenth cycle (bottom) after treatment was added. Red arrows point to puncta. (B–E) Graphs of number of puncta in V4-expressing cells (B,C) or V4-Arc expressing cells (D,E) normalized to first cycle after treatment (V4; vehicle n = 13 dendrites, puro n = 8 dendrites, HHT n = 8 dendrites; V4-Arc vehicle n = 14 dendrites puro n = 10 dendrites, HHT n = 12 dendrites. Puncta were counted with an automated program (Materials and Methods). Experiments came from a minimum of three independent cultures. Vehicle groups from HHT (water) and puromycin (0.0675% Ethanol) were not significantly different from each other and were pooled. The same pooled vehicle groups are used in B,C and D,E. No interaction of time and group was observed for V4 (two-way ANOVA F(18,225) = 1.3, P = 0.20) or V4-Arc (two-way ANOVA F(18,279) = 1.5, P = 0.08). For V4, control vs. HHT and control vs. Puro, Tukey's post-hoc tests P = 0.09 and 0.24, respectively, and for V4-Arc control vs. HHT and control vs. Puro, Tukey's post-hoc tests P = 0.24 and 0.82, respectively. (F) Number of puncta at tenth image cycle (∼12 min after first image cycle) normalized to first image cycle immediately after treatment (n is same as B–E) measured using manual counting of puncta. (F) No groups were significantly different V4 (one-way ANOVA F(28,2) P > 0.5), V4-Arc (one-way ANOVA F(35,2) P > 0.5). (NS) not significant. All errors are shown as standard error of the mean.

