FIG 3.
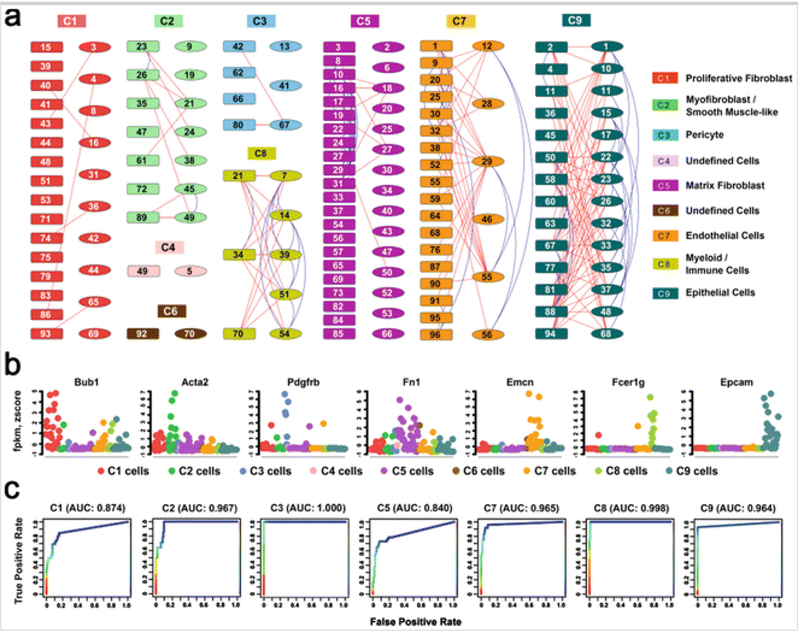
Identification and validation of major lung cell types at E16.5 mouse lung (Adapted from Figs. 2 and 3 in Guo et al. [31]). (a) Cells (n = 148) from two sample preparations from fetal mouse lung at E16.5 [31] were assigned into nine clusters via hierarchical clustering using average linkage and centered Pearson’s correlation. Each color represents a distinct cell cluster, labeled as C1–C9. The rectangles represent single lung cells from the first preparation and the ellipses consist of single cells from a second independent preparation. Connection lines indicate the z-score correlation between the two cells ≥0.05. The blue lines connect cells within the same preparation, while the red lines connect cells across preparations. (b) Expression patterns of representative known cell type markers were used to validate the correct assignment of major lung cell types at E16.5. Expression levels were normalized by per-sample z-score transformation. (c) Receiver Operating Characteristic curves of the rank-aggregation-based validation showed a high consistency between the cell type assignments and the expression patterns of known cell type-specific markers

