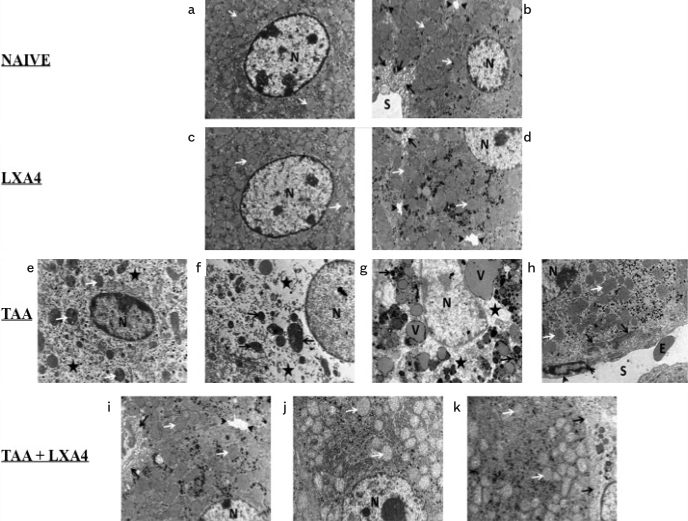
Figure 3.
a–k. Ultrastructural views of liver tissues in naïve (a, b); only LXA4-administered, LXA4 (c, d); liver fibrosis group, TAA (e, f, g, h), and LXA4-administered fibrotic mice, TAA+LXA4 (i, j, k) groups. Scale bars represent 2 mm in all figures. Figure 3a, nucleus of hepatocyte (n), mitochondria (arrow). Figure 3b, nucleus of hepatocyte (N), mitochondria (white arrow), sinusoid (S), space of Disse (black arrow), and bile canaliculi (arrow head). In Figure 3c, nucleus of hepatocyte (N), mitochondria (arrow). In Figure 3d, nucleus of hepatocyte (N), mitochondria (white arrow), space of Disse (black arrow), bile canaliculi (arrow head). Figure 3e, nucleus of hepatocyte (N), mitochondria (white arrow), intracellular edema (aster). In Figure 3f, nucleus of hepatocyte (N), mitochondria (arrow), intracellular edema (aster). In Figure 3g, nucleus of hepatocyte (N), intracellular edema (aster), intracellular vacuole (V), and electron-dense granules (arrow). In Figure 3h, nucleus of hepatocyte (N), mitochondria (white arrow), collagen fibrils in space of Disse (black arrow), sinusoid (S), sinusoidal endothelial cells (arrow head), and erythrocyte (E). In Figure 3i, nucleus of hepatocyte (N), mitochondria (white arrow), space of Disse (black arrow), bile canaliculi (arrow head). Figure 3j, nucleus of hepatocyte (N), mitochondria (arrow). Figure 3k, TAA+lipoxin: Nucleus of hepatocyte (N), mitochondria (white arrow), space of Disse (black arrow).

