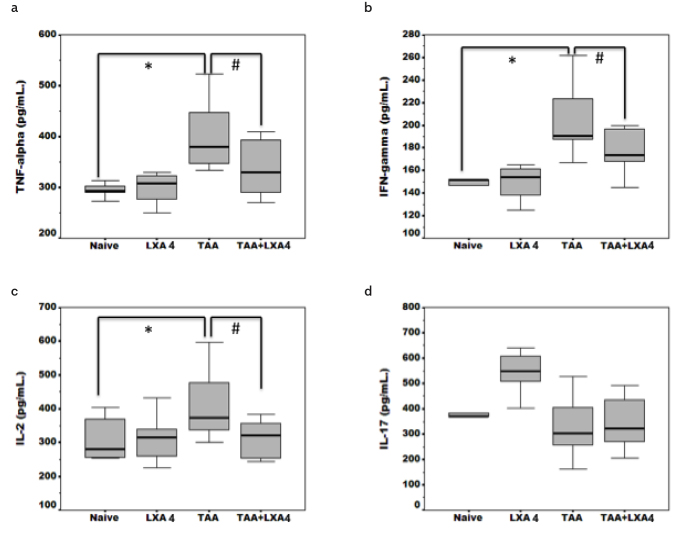
Figure 4.
a–d. Inflammatory cytokine (TNF-α, IFN-g, IL-2, IL-17) (4a–4d) levels in serum samples of animals in each group. The data represent the mean±SD for five animals in two separate experiments.
*symbol represents significant difference between the naïve and TAA group in existing figures. #symbol represents significant difference between the TAA and TAA+ LXA4 group in existing figures.
p<0.01 for IFN-g between the naïve and TAA group.

