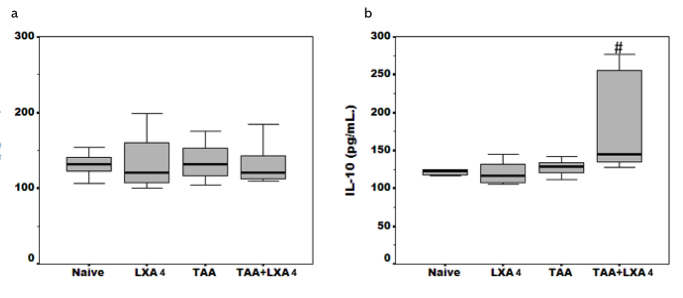
Figure 5. a, b.
Anti-inflammatory cytokine (IL-4 and IL-10) (5a, 5b) levels in serum samples of animals in each group. The data represent the mean±SD for five animals in two separate experiments.
#symbol represents significant difference between the TAA group and TAA+LXA4 group. p=0.032 for IL-10 between the TAA and TAA+LXA4 group.

