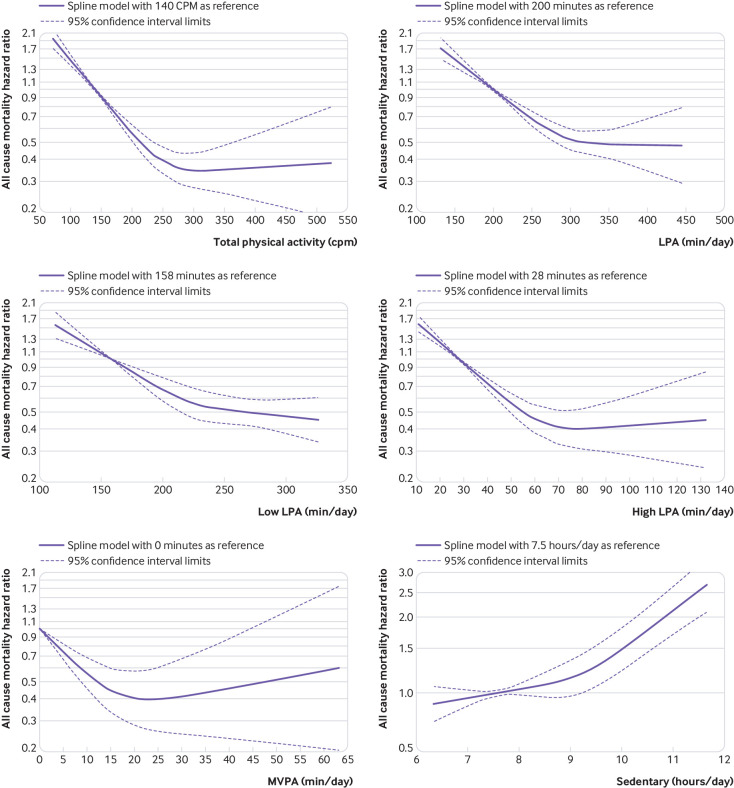
Fig 2.
Dose-response associations between total physical activity (top left), light intensity physical activity (LPA) (top right), low LPA (middle left), high LPA (middle right), moderate-to-vigorous intensity physical activity (MVPA) (bottom left), and sedentary time (bottom right, data from REGARDS (Reasons for Geographic and Racial Differences in Stroke)9 and FHS (Women’s Health Study)12 are only included for MVPA) and all cause mortality. Modelling performed using restricted cubic splines with knots at 25th, 50th, and 75th centiles of exposure specific distribution from medians of quarters (least to most active). The exposure reference is set as the median of the medians in the reference group (least active) (see supplementary table 3). Knot locations are available in supplementary table 8. cpm=counts per minute

