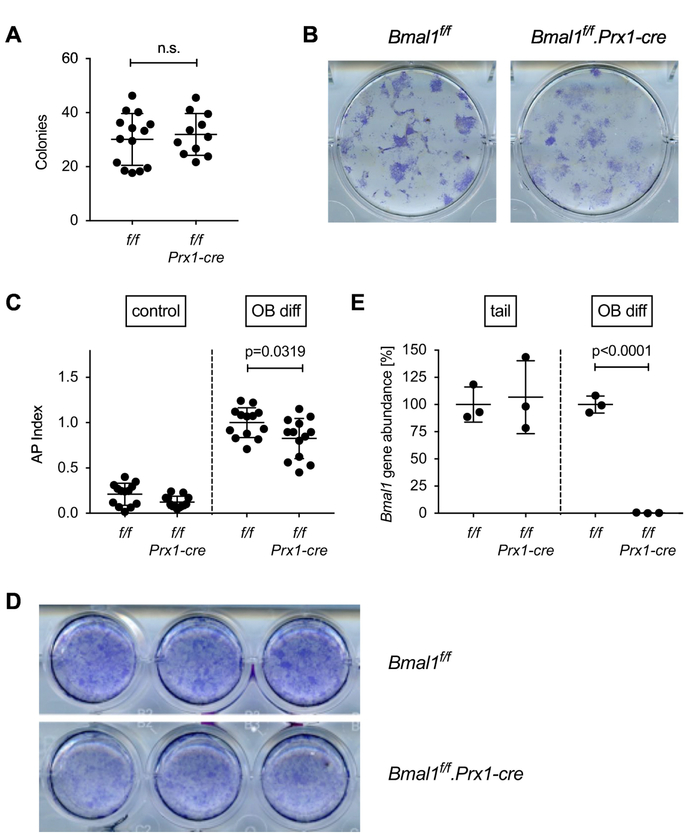
Fig. 5. In vitro osteoblast differentiation from Bmal1f/f.Prx-cre bone marrow.
(A) Cells derived by enzymatic digestion of whole long bones from Bmal1f/f and Bmal1f/f.Prx1-cre mice were differentiated in osteogenic medium for 21 days, and the number of alkaline phosphatase positive colonies was counted. Each data point represents the mean of triplicate cultures from the bone marrow of one mouse, bars are mean and SD of data pooled from 4 experiments. Representative wells are shown in (B). (C) Osteoblast precursors were differentiated in osteogenic medium for 28 days and assayed for alkaline phosphatase activity using a colorimetric assay. The AP index was calculated by normalizing alkaline phosphatase activity to cell viability measured by Alamar Blue assay. Data points represent the mean of triplicate cultures from the bone marrow of individual mice; bars are mean and SD of data pooled from 4 experiments; p value by Student’s t test. (D) Representative wells stained with a non-soluble alkaline phosphatase substrate. (E) Genomic DNA isolated from the tail of Bmal1f/f and Bmal1f/f.Prx1-cre mice or osteoblast cultures from Bmal1f/f and Bmal1f/f.Prx1-cre bone marrow was analyzed for deletion of Bmal1 by real-time quantitative PCR. Each data point represents one animal; bars are mean and SD; p value by Student’s t test.

