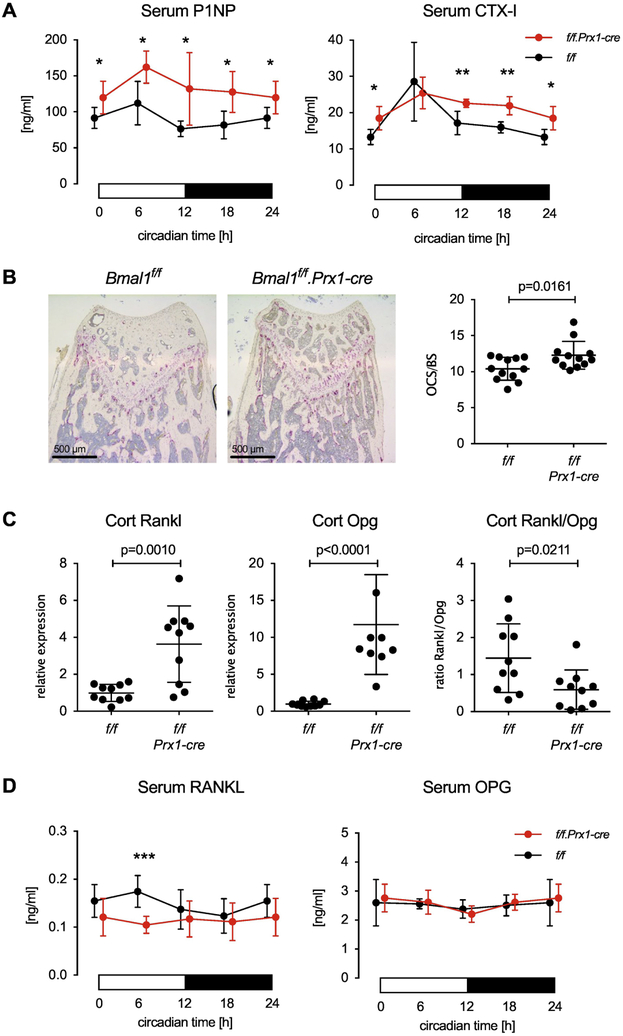
Fig. 6. Enhanced bone turnover in Bmal1f/f.Prx-cre mice.
(A) P1NP and CTX-I measured in the serum of 8-week-old male Bmal1f/f and Bmal1f/f.Prx1-cre littermates collected at 6-hour intervals. Data are mean and SD, n=5 animal per time point and genotype, p values by Student’s t test, * < 0.05, ** < 0.01. (B) Representative TRAP-stained sections of distal femurs from 8-week-old male Bmal1f/f and Bmal1f/f.Prx1-cre littermates. Osteoclast surface (OCS) per bone surface (BS) was measured as described in Methods. 2 slides from each of n=6 mice per genotypes were analyzed, bars are mean and SD; p value by Student’s t test. (C) Rankl, Opg and the ratio of Rankl/Opg gene expression in cortical bone of 8-week-old male Bmal1f/f and Bmal1f/f.Prx1-cre littermates at circadian time 6h, n=10 animals per genotype, p values by Student’s t test. (D) RANKL and OPG serum levels in 8-week-old male Bmal1f/f and Bmal1f/f.Prx1-cre littermates measured in 6-hour intervals, n=7 animals per time point and genotype, p values by Student’s t test, *** < 0.001. In (A) and (D), the 0-hour data are shown at both 0 and 24 hours in order to represent a full 24-hour day.

