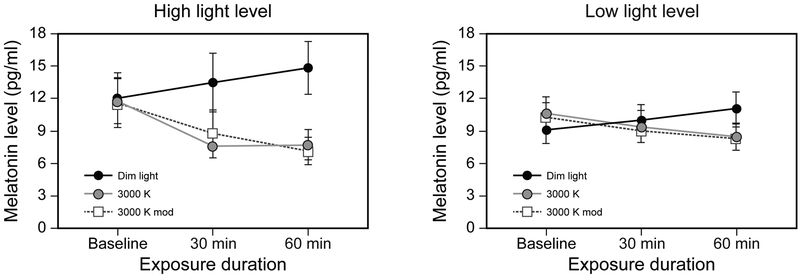
Figure 4.
Raw melatonin data for the dim light control and the 2 intervention spectra for both light levels at baseline and after 30-min and 60-min exposures. The data for the high light level are shown on the left, and those for the low light level are shown on the right. The error bars represent standard error of the mean.

