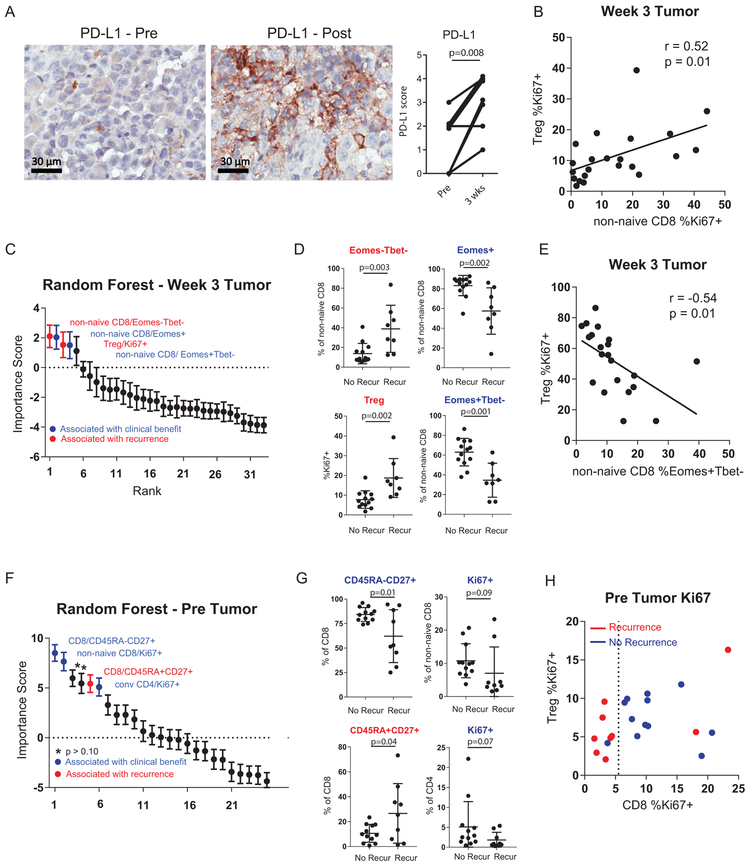
Extended Data Fig. 3. Cellular determinants of response and resistance to anti-PD-1.
A, Changes in tumor PD-L1 pre versus post-treatment using immunohistochemistry staining (n = 9 independent paired patient samples). ** p<0.01 using two-sided Wilcoxon matched-pairs test. B, Correlation of % Ki67+ in non-naïve CD8 T cells versus %Ki67+ in Tregs (FoxP3+ CD4) (n = 21 independent patient samples), R-score and p-value generated using Pearson’s correlation. C, 33 post-treatment immune parameters classified by recurrence using random forest analysis and ranked by importance score (n = 21 independent patient samples). Error bar denotes mean +/− sd for 1000 random forest iterations. D, % expression of selected markers in tumor between patients with recurrence (9 independent patient samples) and no recurrence (12 independent patient samples). P value calculated using two-sided Mann-Whitney test. E, Correlation of % Ki67+ in Tregs (FoxP3+ CD4) versus %Eomes+Tbet- in non-naïve CD8 (n = 21 independent patient samples), R-score and p-value generated using Pearson’s correlation. F, 25 pre-treatment immune parameters classified by recurrence using random forest analysis and ranked by importance score (n = 21 independent patient samples). Error bar denotes mean +/− sd for 1000 random forest iterations. G, % expression of selected markers in tumor between patients with recurrence (9 independent patient samples) and no recurrence (12 independent patient samples). Two-sided t test was used for CD45RA-CD27+ and CD45RA+CD27+ comparisons. Two-sided Mann Whitney test was used for CD8 Ki67+ and CD4 Ki67+ comparisons. Error bar denotes mean +/− sd. H, Scatter plot of %Ki67+ in non-naïve CD8 versus %Ki67+ in FoxP3+ CD4 (Tregs) at pre-treatment stratified by recurrence status. Dotted line denotes non-naïve CD8 Ki67+ of 5.5 calculated by CART analysis as the optimal cutpoint separating recurrence vs no recurrence. (n = 21 independent patient samples).

