Figure 3:
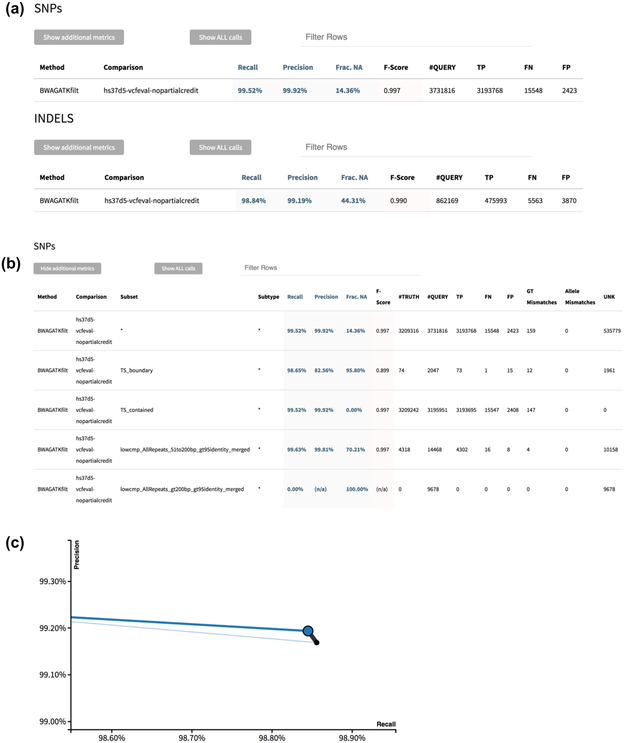
Example standardized HTML report output from hap.py. (a) Tier 1 high-level metrics output in the default view. (b) Tier 2 more detailed metrics and stratifications by variant type and genome context. (c) Precision-recall curve using QUAL field, where the black point is all indels, the blue point is only PASS indels, the dotted blue line is the precision-recall curve for all indels, and the solid blue line is the precision-recall curve for PASS indels.

