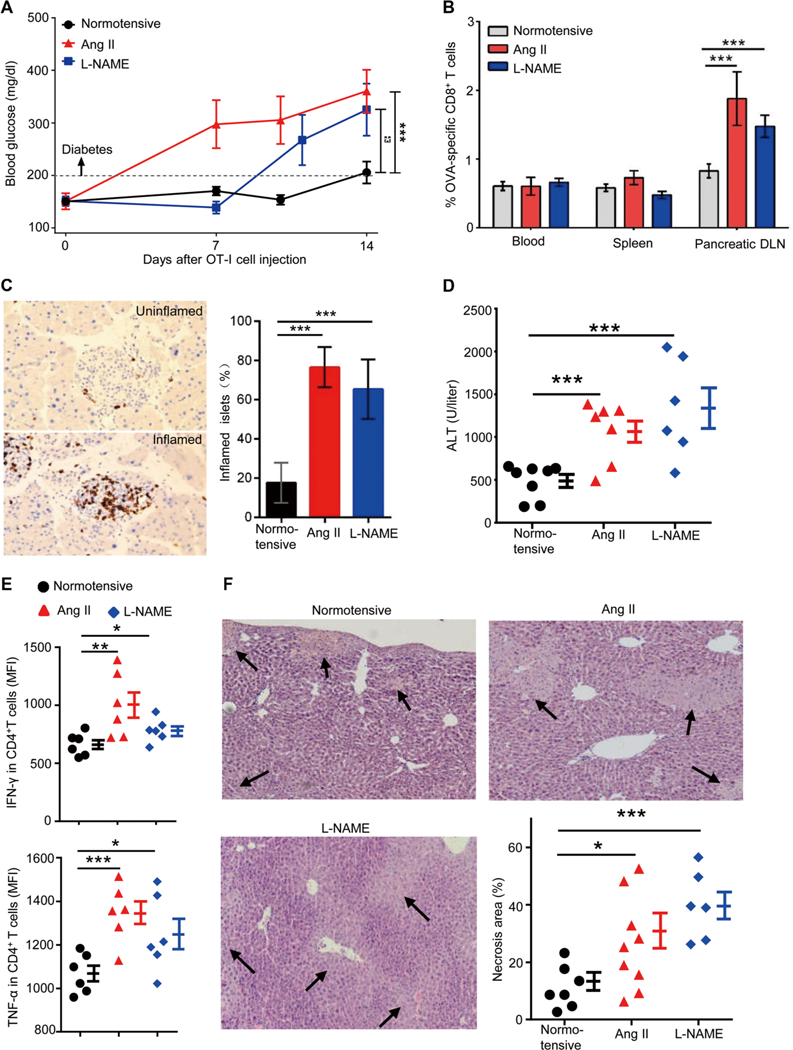
Fig. 2. Hypertensive mice are predisposed to autoimmune diseases.

(A to C) RIP-mOVA mice were made hypertensive by treatment with either Ang II or L-NAME. After 2 to 3 weeks, when hypertension was established, 5 × 10⁶ OT-I T cells (CD8+ T cells from OT-I transgenic mice) were transferred intravenously into normotensive and hypertensive RIP-mOVA mice. (A) Blood glucose levels were measured for 2 weeks after OT-I T cell transfer. (B and C) Two weeks after OT-I T cell transfer, the percentages of OT-I T cells among CD8+ T cells in the blood, spleen, and pancreatic draining lymph nodes (DLN) were quantified by tetramer analysis (B), and the numbers of inflamed islets, identified by anti-CD3 staining, were counted in a blinded fashion (C). (D to F) ConA (5 mg/kg) was injected intravenously into normotensive and hypertensive mice. Blood ALT levels were measured after 6 hours. (D) Hepatic inflammatory cells were prepared by tissue enzymatic digestion followed by Percoll centrifugation. (E) Cells were cultured in medium for 6 hours in the presence of brefeldin A, and then intracellular staining was performed to examine the production of IFN-γ and TNF-α by CD4+ T cells. Liver necrosis area was measured after hematoxylin and eosin staining. MFI, mean fluorescence intensity. (F) For each liver, necrosis area represents the average of 10 separate fields. In (A) to (C), n = 17, 6, and 12 for normotensive, Ang II-treated, and L-NAME-treated mice, respectively. Data are means ± SEM. *P < 0.05; **P < 0.01; ***P < 0.005.
