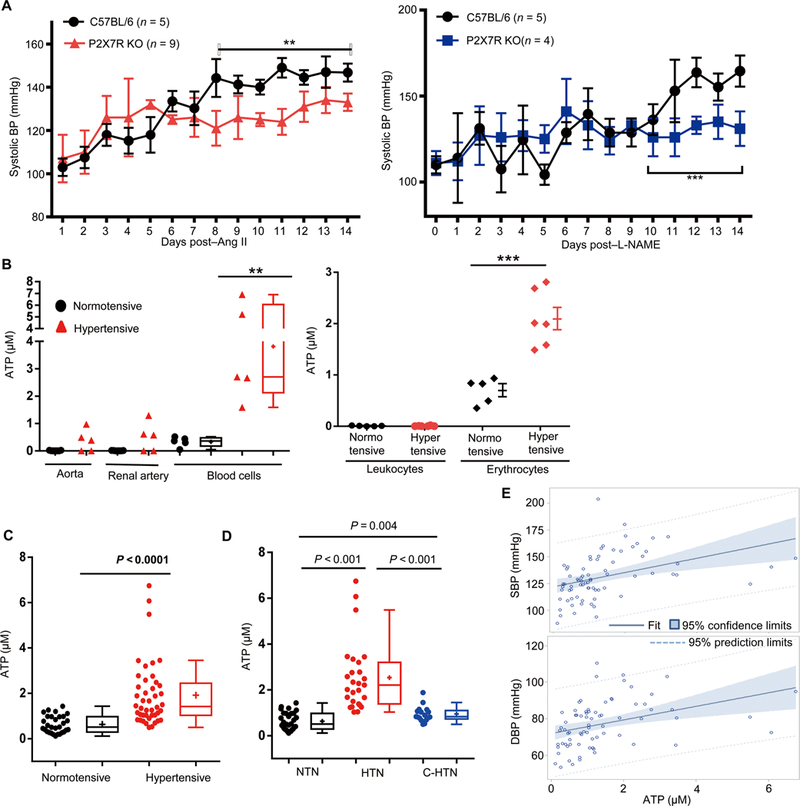
Fig. 8. The correlation of plasma ATP levels and P2X7 receptor expression with BP in mice and humans.

(A) BP of P2X7 knockout mice was made hypertensive with Ang II (left) or L-NAME (right). Two-way ANOVA with Bonferroni’s correction was used for BP data analysis. (B) Aorta, renal arteries, and total blood cells were collected from normotensive mice and hypertensive mice treated with Ang II for 2 weeks. Some blood cells were further separated to isolate leukocytes and erythrocytes with Percoll gradients. The arteries and cells were placed in serum-free medium for 3 hours, and the ATP levels in the medium were measured. (C) Distribution of plasma ATP in hypertensive patients and normotensive controls. The Kruskal-Wallis nonparametric test was used for analysis. (D) Distribution of plasma ATP in normotensive people (NTN), hypertensive patients with BPs not well controlled (HTN), and hypertensive patients with BP controlled to normal levels (C-HTN). Wilcoxon rank sum test (LSD test adjusted) was used for analysis. (E) Fit plots between ATP and SBP (left) and between ATP and DBP (right) among all subjects. *P < 0.05; **P < 0.01; ***P < 0.005.
