15.

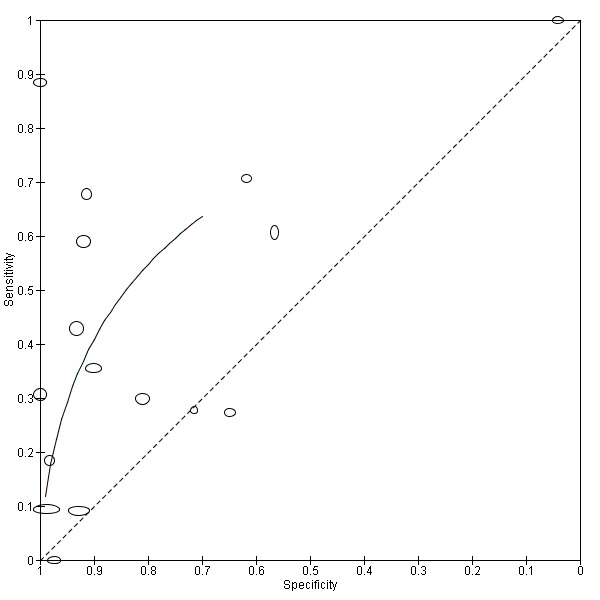
Summary ROC plot for real‐time polymerase chain reaction (PCR) on blood products.
Transparent dots indicate the test accuracy of the individual studies included in the analysis. The solid black line (summary ROC curve) is a graph of the values of sensitivity and specificity that are obtained by varying the threshold across all possible values.The size of the transparent dots represents the sample size, with the vertical diameter representing the number of cases and horizontal diameter representing the number of non‐cases.
