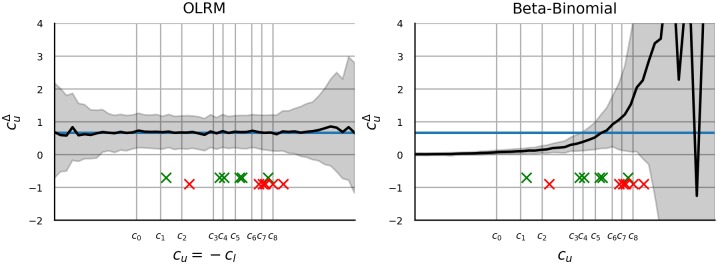
Fig 10. Parameter recovery with Ordered logistic regression and Beta-binomial distribution.
Figure shows the estimate of group difference on vertical axis that was obtained by fitting OLRM (left panel) and Beta-binomial distribution (right panel) to the data generated with OLRM by manipulating the magnitude of ceiling effect cu. cu is shown on the horizontal axis and the magnitude of the ceiling effect increases from left to right. In reference to the precise notation in section 2.3, the black line shows the median estimate of the group difference , while the gray surface shows the estimate’s 95% interval. The blue line shows the true value used by OLRM that generated the data and the true value corresponds to an OLRM estimate of group difference in [1] (i.e. median estimate of d0). The crosses show the difficulty of the six items (i.e. ) in the original study (green [1]) and in the replication study (red [2]), while ci and grid lines of the horizontal axis show the OLRM thresholds obtained by pooling the original and replication data.

