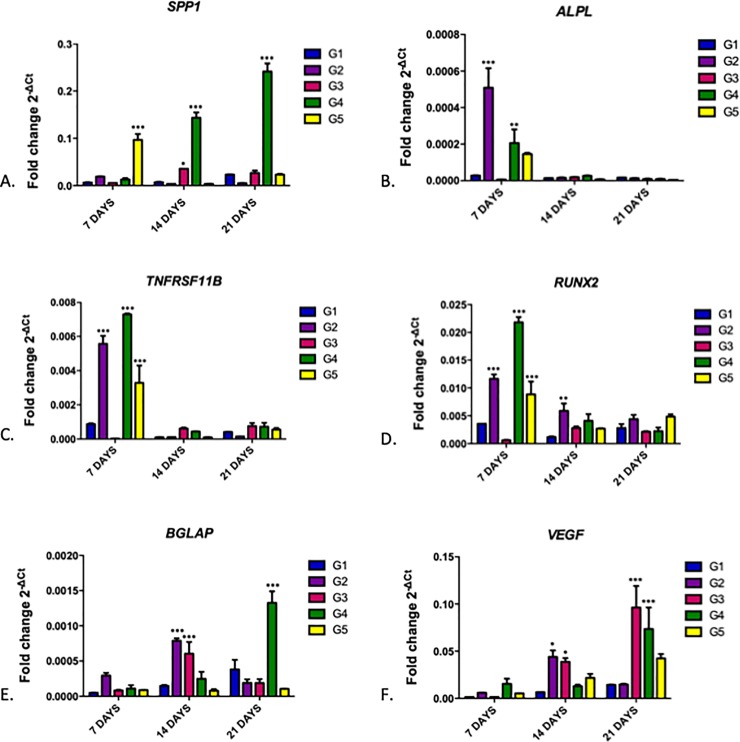
Fig 7. Quantitative RT-qPCR analysis of cultured MC3T3-E1 cells after G1, G2, G3, G4 and G5 group treatments over 7, 14, and 21 days, demonstrating gene expression of SPP1 (A), ALPL (B), TNFRSF11B (C), RUNX2 (D), BGLAP (E), and VEGF (F) genes normalized by the GAPDH gene.
Bars indicate mean gene expression (2-ΔCt) +/- standard error. Two-way ANOVA followed by the Bonferroni Test. *** = p <0.001; ** = p <0.1, * = p <0.05, compared to the control group (G1) for each period.

